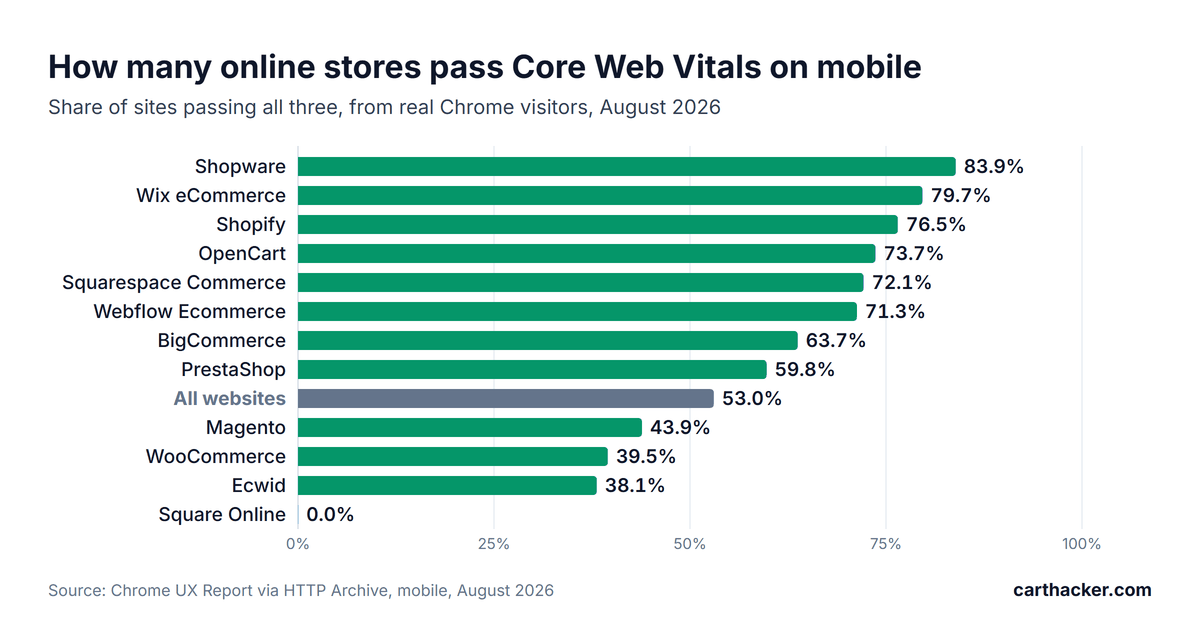
In August 2026, 76.5% of Shopify stores passed all three Core Web Vitals on mobile, against 39.5% of WooCommerce stores and 53.0% of all websites. Wix eCommerce stores passed at 79.7%, Squarespace Commerce at 72.1%, BigCommerce at 63.7% and Magento at 43.9%. Those are real visits. Google collects them from Chrome users for the Chrome UX Report, and the HTTP Archive matches every measured site to the software it runs on, which turns them into a speed census of about 1.58 million online stores on 48 platforms, month by month since January 2020.
Platform averages hide most of the story. Shopify stores pass at 76.5% overall and at 39.2% among those ranked in the 100,000 most visited sites on the web. Squarespace answers quickly for 93.4% of its stores when the visitor is in the United States and for 12.7% when the visitor is in Australia, on the same platform in the same month. One platform, Square Online, has never had more than 0.4% of its sites pass since it first appeared in the data in February 2022. The dataset is public under DOI 10.5281/zenodo.23134346, together with the two scripts that rebuild every figure in this report, so each number can be checked and reused.
What the 2026 store speed data shows
- Self-hosted stores lose on the server. Only 12.7% of WooCommerce sites, 22.5% of Magento sites and 24.9% of PrestaShop sites answer a phone within Google's 800 millisecond mark for server response, against 81.9% of Shopify sites and 79.3% of Squarespace Commerce sites.
- The pass rate more than doubled in five years. 22.1% of all websites passed on mobile in January 2021 and 53.0% in August 2026. Shopify went from 23.8% to 76.5%, WooCommerce from 8.3% to 39.5%.
- Shopify slipped for the first time. Its pass rate fell from 77.4% to 76.5% in a year, its good server response from 86.8% of stores in 2024 to 81.9%, and the JavaScript on a median Shopify home page grew from 860 KB in 2021 to 2,178 KB.
- The most visited stores are the slowest. 39.2% of the Shopify stores among the 100,000 most visited sites pass, against 76.5% of all Shopify stores.
- The shopper's country moves the score as far as the platform does. Shopify passes for 85.3% of its stores with visitors in the United States and for 51.6% with visitors in Brazil.
- A lighter theme lifts Magento by 24 points. Magento stores on the Hyva theme pass at 67.9%, against 43.9% for Magento overall, on servers just as slow.
- Enterprise pricing buys no speed. Salesforce Commerce Cloud passes at 38.4%, SAP Commerce Cloud at 32.5% and VTEX at 3.8%.
- Square Online fails across the board. 0.0% of its 9,116 measured sites pass, and five Square Online stores I loaded myself took between 17 and 27 seconds to draw their main content.
Which ecommerce platform is the fastest?
Among the twelve platforms in the ranking chart, Shopware stores pass Core Web Vitals on mobile most often, 83.9% of them, followed by Wix eCommerce at 79.7% and Shopify at 76.5%. Passing means all three scores are good at once: Loading (Largest Contentful Paint) within 2.5 seconds, Responsiveness (Interaction to Next Paint) within 200 milliseconds and Visual stability (Cumulative Layout Shift) at 0.1 or lower, each measured at the 75th percentile of a site's real visits in the month. Miss one and the site fails.
| Platform | Sites measured | Pass all three | Loading | Responsiveness | Visual stability | Server response | Passed a year earlier |
|---|---|---|---|---|---|---|---|
| Shopware | 8,392 | 83.9% | 90.4% | 97.3% | 93.7% | 44.5% | 79.1% |
| Wix eCommerce | 127,867 | 79.7% | 83.5% | 92.8% | 97.7% | 67.2% | 70.7% |
| Shopify | 443,647 | 76.5% | 87.3% | 87.4% | 92.5% | 81.9% | 77.4% |
| OpenCart | 20,404 | 73.7% | 83.5% | 94.2% | 89.5% | 39.9% | 69.9% |
| Squarespace Commerce | 93,787 | 72.1% | 79.6% | 97.5% | 89.1% | 79.3% | 58.6% |
| Webflow Ecommerce | 8,404 | 71.3% | 77.2% | 90.6% | 94.4% | 61.4% | 62.6% |
| BigCommerce | 11,704 | 63.7% | 85.3% | 96.8% | 73.0% | 63.9% | 69.1% |
| PrestaShop | 49,523 | 59.8% | 72.0% | 90.3% | 85.0% | 24.9% | 54.9% |
| All websites | 8,733,157 | 53.0% | 65.8% | 80.1% | 83.1% | 45.8% | 50.8% |
| Magento | 32,992 | 43.9% | 57.6% | 85.0% | 70.1% | 22.5% | 38.1% |
| WooCommerce | 557,369 | 39.5% | 43.7% | 91.7% | 88.3% | 12.7% | 35.4% |
| Ecwid | 4,954 | 38.1% | 49.5% | 84.1% | 68.3% | 40.0% | 32.5% |
| Square Online | 9,116 | 0.0% | 0.3% | 47.4% | 0.3% | 41.2% | 0.0% |
Read the columns before the ranking. WooCommerce passes Responsiveness more often than Shopify, 91.7% against 87.4%, and still fails the whole test more than twice as often, because only 43.7% of its sites get the main content on screen in time. BigCommerce is the mirror image. Its sites load and react well, 85.3% and 96.8%, and only 73.0% of them keep the layout still, which drags the platform down to 63.7%. Every platform fails in one place first, and that place is where an owner's first hour of work belongs.
Smaller regional platforms lead the full 48-platform table, with Hungary's Unas at 93.2%, Lightspeed eCom at 92.0%, Japan's stores.jp, MakeShop and ColorMeShop at 91.7%, 90.5% and 90.2%, and Czechia's Shoptet at 88.1%. Five of those six also give more than 85% of their sites a good server response.
Check your store's Core Web Vitals for free
Paste a product page address. You get the three scores right away, and a free account names every slow app and the fix for your platform.
Test my storeWhy do self-hosted stores fail on server response?
Self-hosted stores fail on server response because the platform hands the server to the owner, and most owners run it on hosting that cannot answer a phone within 800 milliseconds. Server response (Time to First Byte) is the wait between the browser asking for a page and the first byte of its HTML arriving. It is not a Core Web Vital. It sits under all three, since no image, stylesheet or script on the page can start downloading before that first byte lands.
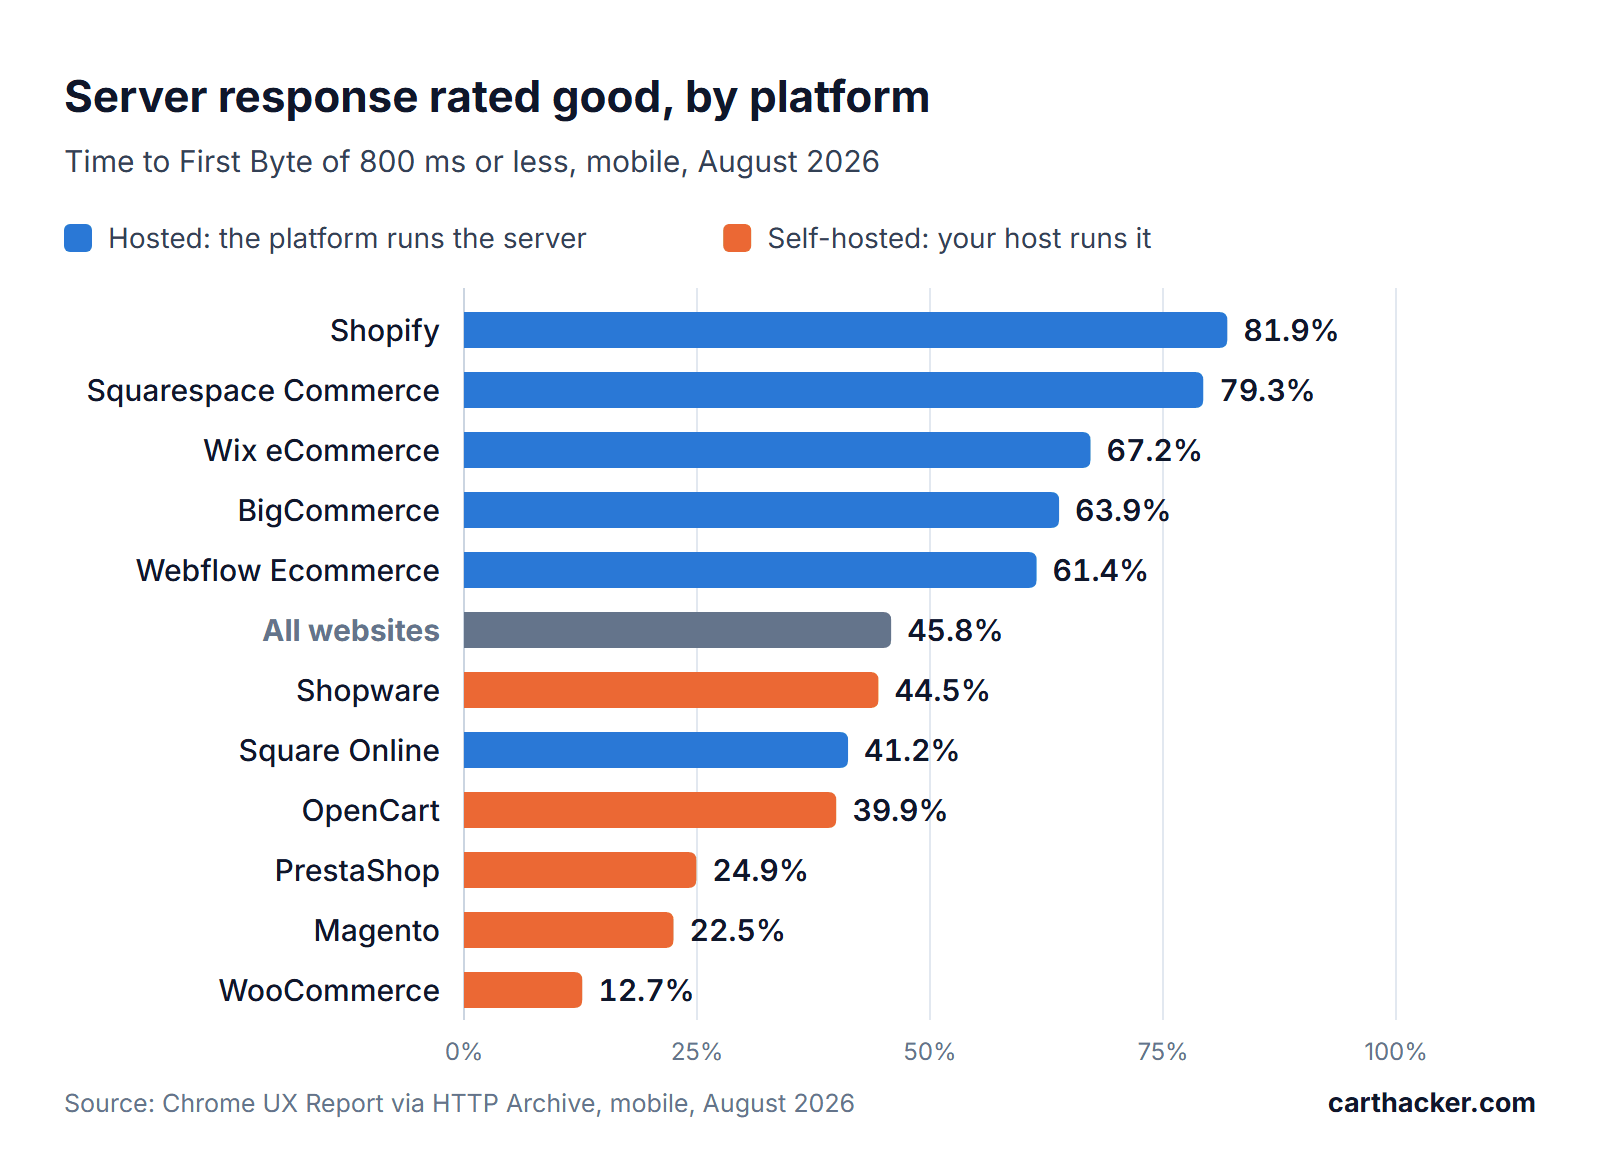
The split is almost clean. Every hosted platform in the chart except Square Online gives at least 61.4% of its sites a good server response, led by Shopify at 81.9% and Squarespace Commerce at 79.3%. Every self-hosted platform stays under the web-wide 45.8%, and WooCommerce, the platform with the most sites in this dataset, sits at the bottom with 12.7%.
WooCommerce's server number has not moved in five years. In August 2021, 14.9% of WooCommerce sites had a good server response, and in August 2026, 12.7%. Over the same years the share with good Loading went from 19.5% to 43.7%, which is roughly what image compression, lazy loading and page caching can do on top of a slow server. None of them helps an uncached visitor. On a store that visitor is common: a shopper with items in the cart, a logged-in customer, a product page opened from an ad with tracking parameters in the address.
Shopware is the exception. Only 44.5% of its sites get a good server response, and it still tops the ranking chart at 83.9%, with home pages that carry a median of 597 KB of JavaScript against 2,178 KB on Shopify. Its audience helps as well: 6,364 of its 8,392 measured sites have enough visitors in Germany to be measured there, and for German visitors 88.6% of them pass.
The server work for WooCommerce, from page caching to PHP workers, is in why WooCommerce stores are slow, and what to pay a host for is in choosing WooCommerce hosting.
How have store speeds changed since 2021?
Store speeds improved on every large platform between 2021 and 2026, and the share of all websites passing Core Web Vitals on mobile went from 22.1% in January 2021 to 53.0% in August 2026. Shopify climbed from 23.8% to 76.5%. WooCommerce went from 8.3% to 39.5%, nearly five times its 2021 share, and still finishes under the web average.
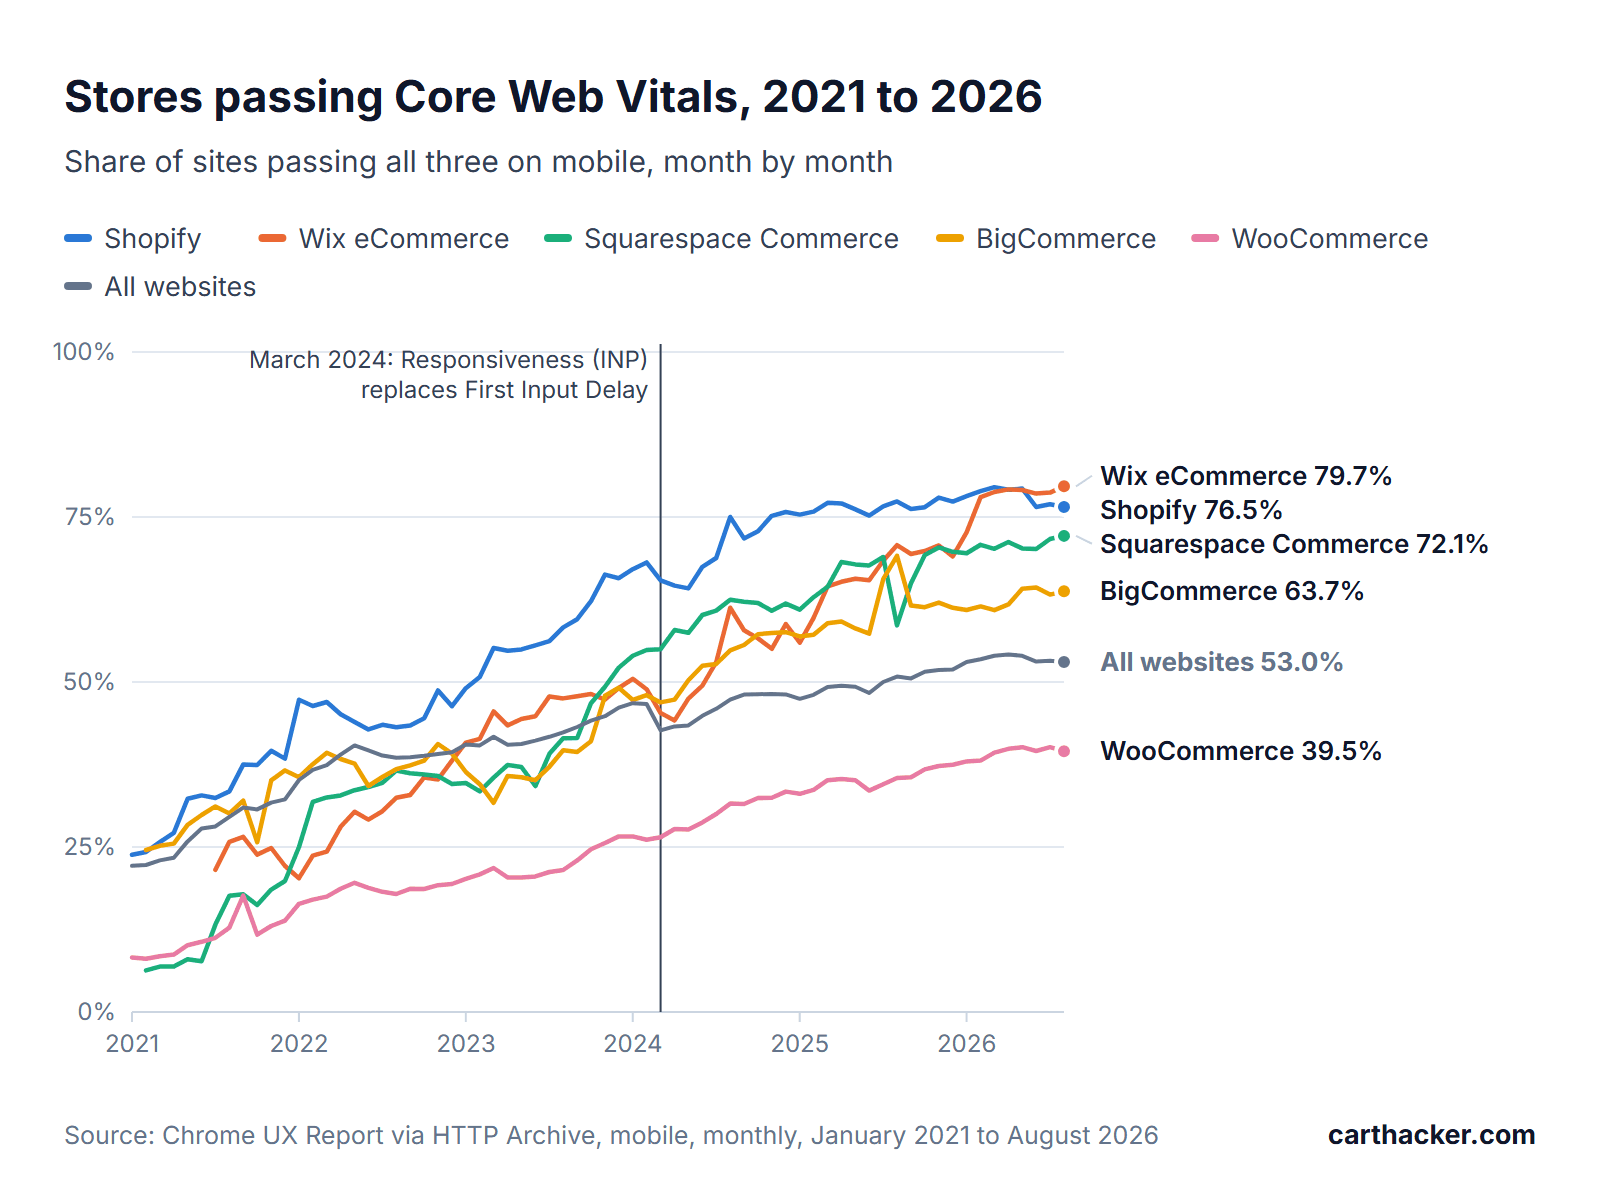
The one sharp drop on the chart is March 2024. That month Google replaced First Input Delay with Interaction to Next Paint as the Responsiveness metric, and the share of all websites passing fell from 46.7% to 42.7% between February and March. The drop came from the new test. First Input Delay timed only the wait before the browser started handling the first tap of a visit, and in February 2024 it rated 94.8% of sites good. Interaction to Next Paint times every tap, click and key press until the screen visibly reacts, and the same month it rated 69.2% of sites good.
Platforms took the switch differently. Shopify fell from 68.1% to 65.4% and Wix eCommerce from 48.9% to 45.3%, while WooCommerce did not move, 26.1% to 26.5%, because its sites were already failing on Loading and a second failed score changes nothing. Two and a half years later, 80.1% of all websites pass Interaction to Next Paint on mobile.
The last twelve months reshuffled the middle of the ranking. Squarespace Commerce gained 13.6 points, Wix eCommerce 8.9 and Webflow Ecommerce 8.7, and the Latin American platform sold as Nuvemshop in Brazil and as Tiendanube elsewhere gained 21.1 and 18.1 points under its two names. BigCommerce lost 5.4 points, the largest fall among platforms with more than 5,000 sites. Shopify lost 0.9.
Is Shopify getting slower?
Slightly, and for the first time in the data. The share of Shopify stores passing Core Web Vitals on mobile fell from 77.4% in August 2025 to 76.5% in August 2026, its first August-to-August drop in a record that starts in January 2020. Two measurements underneath it slipped as well:
- Server response rated good fell from 86.8% of Shopify stores in August 2024 to 86.0% a year later and 81.9% in August 2026.
- Responsiveness rated good fell from 89.8% to 87.4% in the last year, the lowest of the four platforms with more than 90,000 measured sites.
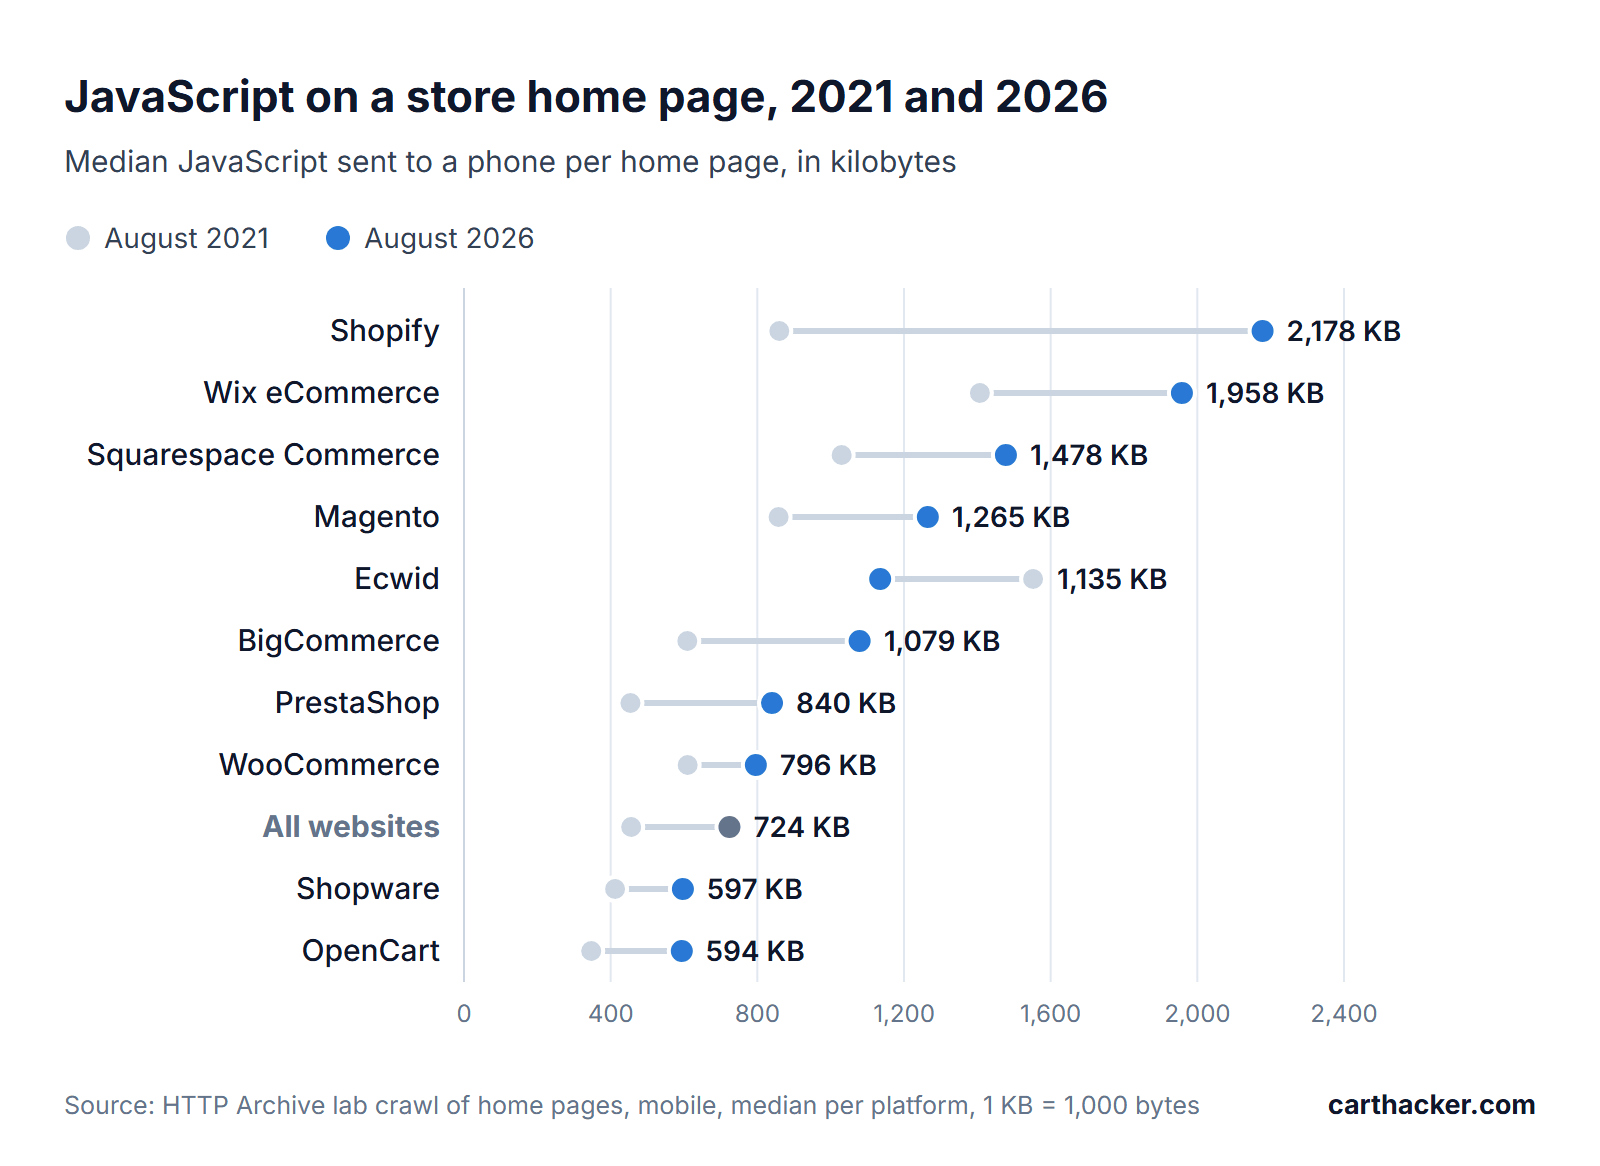
The likeliest reason is weight. The median Shopify home page sent 860 KB of JavaScript to a phone in August 2021 and 2,178 KB in August 2026, 2.5 times as much and the most of any large platform in the chart. JavaScript is the expensive kind of byte. A photo is decoded once and painted, while a script has to be parsed, compiled and run on the phone's main thread, the same single lane that has to react when a shopper taps Add to Cart. On Shopify that code comes from two places, the theme and the apps, and finding the app that slows down a Shopify store is the method for telling them apart.
Shopify still leads WooCommerce by 37.0 points on the pass rate. In August 2024 the lead was 43.4 points, and it is now closing from both ends.
Are big stores faster than small ones?
No. The most visited stores pass Core Web Vitals less often than the rest, and on Shopify the gap is 37 points: 39.2% of the Shopify stores ranked among the 100,000 most visited sites on the web pass on mobile, against 64.4% in the top million and 76.5% across all measured Shopify stores. The rank buckets come from the Chrome UX Report's own popularity ranking, and each bucket also contains every higher-ranked site.
| Platform | Top 100,000 sites | Top 1 million sites | All measured sites |
|---|---|---|---|
| All websites | 42.2% (73,625) | 46.5% (755,159) | 53.0% (8,733,157) |
| Shopify | 39.2% (1,903) | 64.4% (48,583) | 76.5% (443,647) |
| WooCommerce | 39.0% (326) | 43.4% (22,595) | 39.5% (557,369) |
| Magento | 28.6% (783) | 41.4% (8,293) | 43.9% (32,992) |
| PrestaShop | 53.2% (186) | 54.9% (6,296) | 59.8% (49,523) |
| BigCommerce | too few sites | 55.5% (1,693) | 63.7% (11,704) |
| OpenCart | too few sites | 69.1% (2,132) | 73.7% (20,404) |
Share passing all three on mobile in August 2026, with the number of sites measured in brackets. Segments under 100 sites are left out.
The data does not say why. The likely causes sit in the page source of any large store: a tag manager firing a dozen marketing tags, a personalization or A/B testing script that hides the page until it decides what to show, review, loyalty, chat and subscription apps stacked on one product page, and more paid traffic that lands cold on a phone. WooCommerce is the exception, between 39.0% and 43.4% at every rank, probably because its sites are held back at the server before any of that code gets a chance to run.
Monitor your store's Core Web Vitals every day, for free
One snippet in your theme measures real shoppers. A free account keeps 7 days of history, Premium keeps 180.
Create a free accountDoes the shopper's country change the score?
Yes, as much as the platform. The Chrome UX Report also groups visits by the visitor's country, and the same platform can pass for most of its stores in one market and for half of them in another: Shopify passes for 85.3% of its stores with visitors in the United States and for 51.6% with visitors in Brazil.
| Visitors in | Shopify | WooCommerce | Wix eCommerce | Squarespace Commerce | All websites |
|---|---|---|---|---|---|
| United States | 85.3% | 55.2% | 88.3% | 83.4% | 63.7% |
| United Kingdom | 84.3% | 56.5% | 90.1% | 85.1% | 67.4% |
| Canada | 87.5% | 59.2% | 92.4% | 87.4% | 67.3% |
| Australia | 79.6% | 46.6% | 85.5% | 64.7% | 53.5% |
| Germany | 82.1% | 51.2% | 90.1% | 79.5% | 68.7% |
| France | 72.6% | 45.7% | 86.1% | 71.5% | 61.7% |
| Netherlands | 80.4% | 61.0% | 88.1% | 80.8% | 66.0% |
| Spain | 66.8% | 37.4% | 78.9% | 61.6% | 52.6% |
| Italy | 64.8% | 32.1% | 76.6% | 59.7% | 52.0% |
| Poland | 70.9% | 47.8% | 83.4% | 67.7% | 62.8% |
| Japan | 83.0% | 53.7% | 90.5% | 57.0% | 71.7% |
| India | 53.1% | 25.3% | 52.8% | 9.1% | 31.8% |
| Brazil | 51.6% | 30.3% | 66.7% | 28.3% | 33.9% |
Share of sites passing all three on mobile in August 2026, measured from visitors in each country.
Server response shows where distance bites. Squarespace Commerce gives a good server response to 97.4% of its sites for visitors in the United Kingdom and to 93.4% in the United States, then to 12.7% in Australia, 6.8% in Brazil and 2.0% in India. Shopify keeps it good for between 79.8% and 93.5% of its stores in 11 of the 13 countries, with India (47.8%) and Brazil (56.5%) the two exceptions. WooCommerce tops out at 23.1%, for visitors in Canada.
India and Brazil are hard on everyone. Only 31.8% and 33.9% of all websites pass for visitors there, against 71.7% for visitors in Japan, which says as much about the phones and mobile networks shoppers use as about any store. The practical reading is short: judge your speed in the countries your customers live in, because a store that passes for shoppers at home can fail for the ones it ships to abroad.
Can a lighter theme fix a slow platform?
On Magento, by 24 points. Magento stores built on Hyva, a frontend theme that replaces Magento's default Luma storefront and most of its JavaScript, pass Core Web Vitals on mobile at 67.9%, against 43.9% for Magento as a whole. Loading is good on 78.1% of Hyva sites against 57.6%, Visual stability on 89.2% against 70.1%, and the median Hyva home page carries 764 KB of JavaScript against 1,265 KB.
The server is the control. Hyva sites get a good server response 23.5% of the time and Magento sites overall 22.5%, so the theme leaves the slow part of the stack where it was and still wins. The caveat is self-selection: an owner who pays for a Hyva build is also more likely to pay for image work, a short app list and better hosting, so part of the 24 points belongs to them. The same decision exists on every platform at a smaller scale, from a Shopify theme with fewer app blocks to a WooCommerce product template built without a page builder.
Do enterprise platforms load faster?
No. The enterprise platforms pass less often than Shopify or Wix, with Salesforce Commerce Cloud at 38.4% of 3,699 measured sites, SAP Commerce Cloud at 32.5% of 2,000 and VTEX at 3.8% of 3,250. Amazon Webstore passes at 20.6%, with a median of 4,359 KB of JavaScript on its home pages, the heaviest in the dataset.
Enterprise budgets buy custom code, and custom code is where the time goes. Large retail sites run more tags, more personalization and more third-party services than a small store, and an enterprise platform gives a development team the freedom to add every one of them.
Why does almost no Square Online store pass?
Square Online stores almost never pass because their main content arrives late and moves once it arrives. In August 2026, 0.0% of the 9,116 measured Square Online sites passed Core Web Vitals on mobile. Loading was good on 0.3% of them and Visual stability on 0.3%, while First Contentful Paint, the moment the first text or image appears, was good on 96.1%. The page starts fast. The store inside it does not.
No single bad month explains it. Since the platform first appeared in the data in February 2022, its pass rate has never exceeded 0.4%.
Does a high lab score mean a store passes?
No. The platform data shows how loosely the two are tied. Across the 48 platforms, the median Lighthouse performance score on mobile and the share of sites passing Core Web Vitals barely move together, with a rank correlation of 0.21, where 1 would mean the lab ranks the platforms exactly the way real visitors do. Shoptet's median lab score is 35.5 out of 100 and 88.1% of its sites pass in the field. Squarespace Commerce scores 28.5 in the lab and passes on 72.1% of its sites, while WooCommerce scores 37 and passes on 39.5%.
The lab test loads one page once, on a simulated mid-range phone over a throttled connection, and it never taps anything, so it cannot measure Responsiveness at all. Field data is the verdict Google uses. The difference is explained in full in what Google's speed scores mean for your store.
Speed data for all 48 platforms
The table lists every platform in the HTTP Archive ecommerce category with at least 2,000 sites measured on mobile in August 2026, ordered by the number of sites. The first two rows are the reference points: every website in the Chrome UX Report, and every site where the HTTP Archive found a shopping cart, on any platform or none. Hyva is a Magento theme.
| Platform | Sites measured | Pass all three | Loading | Responsiveness | Visual stability | Server response |
|---|---|---|---|---|---|---|
| All websites | 8,733,157 | 53.0% | 65.8% | 80.1% | 83.1% | 45.8% |
| Any site with a shopping cart | 1,751,005 | 59.5% | 70.7% | 85.4% | 84.7% | 49.9% |
| WooCommerce | 557,369 | 39.5% | 43.7% | 91.7% | 88.3% | 12.7% |
| Shopify | 443,647 | 76.5% | 87.3% | 87.4% | 92.5% | 81.9% |
| Wix eCommerce | 127,867 | 79.7% | 83.5% | 92.8% | 97.7% | 67.2% |
| Squarespace Commerce | 93,787 | 72.1% | 79.6% | 97.5% | 89.1% | 79.3% |
| PrestaShop | 49,523 | 59.8% | 72.0% | 90.3% | 85.0% | 24.9% |
| 1C-Bitrix | 47,569 | 59.1% | 73.7% | 78.3% | 88.6% | 44.7% |
| Magento | 32,992 | 43.9% | 57.6% | 85.0% | 70.1% | 22.5% |
| OpenCart | 20,404 | 73.7% | 83.5% | 94.2% | 89.5% | 39.9% |
| Tiendanube | 18,044 | 78.7% | 98.1% | 86.4% | 89.3% | 50.2% |
| Amazon Webstore | 14,128 | 20.6% | 61.7% | 37.9% | 41.8% | 33.2% |
| Nuvemshop | 13,000 | 78.5% | 96.8% | 83.7% | 91.3% | 39.9% |
| BigCommerce | 11,704 | 63.7% | 85.3% | 96.8% | 73.0% | 63.9% |
| Shoptet | 9,388 | 88.1% | 98.9% | 93.4% | 93.4% | 98.0% |
| Square Online | 9,116 | 0.0% | 0.3% | 47.4% | 0.3% | 41.2% |
| Webflow Ecommerce | 8,404 | 71.3% | 77.2% | 90.6% | 94.4% | 61.4% |
| Shopware | 8,392 | 83.9% | 90.4% | 97.3% | 93.7% | 44.5% |
| Tray | 7,869 | 62.5% | 69.0% | 91.8% | 90.5% | 20.3% |
| Salla | 7,719 | 3.1% | 61.5% | 76.2% | 6.4% | 4.1% |
| Shopline | 7,190 | 62.1% | 86.4% | 88.2% | 76.5% | 29.1% |
| Cafe24 | 7,178 | 65.2% | 92.2% | 96.0% | 70.1% | 79.2% |
| Loja Integrada | 5,655 | 52.9% | 67.6% | 91.3% | 71.3% | 9.9% |
| ColorMeShop | 5,539 | 90.2% | 98.2% | 93.2% | 95.9% | 90.3% |
| Ecwid | 4,954 | 38.1% | 49.5% | 84.1% | 68.3% | 40.0% |
| Hyva (a Magento theme) | 4,606 | 67.9% | 78.1% | 91.2% | 89.2% | 23.5% |
| MakeShop | 4,339 | 90.5% | 98.5% | 97.1% | 93.8% | 85.8% |
| Unas | 3,880 | 93.2% | 98.3% | 95.1% | 98.8% | 71.2% |
| Salesforce Commerce Cloud | 3,699 | 38.4% | 73.2% | 60.7% | 67.0% | 34.3% |
| Lightspeed eCom | 3,529 | 92.0% | 99.2% | 99.4% | 92.9% | 96.8% |
| JTL Shop | 3,465 | 86.3% | 91.1% | 96.8% | 96.6% | 41.4% |
| Ikas | 3,395 | 2.8% | 5.4% | 7.6% | 82.7% | 34.8% |
| nopCommerce | 3,374 | 69.6% | 79.4% | 94.6% | 86.7% | 31.6% |
| VTEX | 3,250 | 3.8% | 8.5% | 39.8% | 23.3% | 4.2% |
| EC-CUBE | 3,077 | 82.0% | 89.3% | 93.3% | 95.2% | 52.2% |
| Kajabi | 3,039 | 75.1% | 81.5% | 94.0% | 93.4% | 11.2% |
| CS Cart | 2,850 | 63.8% | 78.1% | 83.0% | 87.9% | 31.9% |
| stores.jp | 2,786 | 91.7% | 99.4% | 99.3% | 92.3% | 95.6% |
| EasyDigitalDownloads | 2,646 | 33.9% | 39.9% | 88.3% | 83.3% | 12.8% |
| Haravan | 2,591 | 50.2% | 79.8% | 75.2% | 72.8% | 28.9% |
| ePages | 2,450 | 63.9% | 81.0% | 93.9% | 77.0% | 19.3% |
| Pimcore | 2,430 | 79.5% | 86.1% | 95.8% | 92.2% | 59.1% |
| Powergap | 2,350 | 83.5% | 88.4% | 96.5% | 94.9% | 7.7% |
| Bizweb | 2,320 | 61.2% | 87.6% | 81.6% | 76.2% | 39.1% |
| Jumpseller | 2,282 | 65.7% | 72.7% | 95.3% | 87.0% | 5.9% |
| YouCan | 2,261 | 8.8% | 9.6% | 22.9% | 88.1% | 0.7% |
| Shoprenter | 2,250 | 81.8% | 93.5% | 98.5% | 87.4% | 32.1% |
| inSales | 2,241 | 53.1% | 55.6% | 96.9% | 87.3% | 0.8% |
| Shoper | 2,144 | 61.9% | 94.0% | 67.8% | 85.7% | 51.8% |
| Base | 2,035 | 74.7% | 82.1% | 98.4% | 90.8% | 1.2% |
| SAP Commerce Cloud | 2,000 | 32.5% | 64.7% | 75.4% | 53.6% | 44.5% |
How the data was collected
- Source: the Chrome UX Report (CrUX), Google's public dataset of real page loads from Chrome users who have usage statistics reporting turned on, on desktop and on Android. Chrome on iOS, Android apps that open pages in a WebView and other Chromium browsers such as Microsoft Edge are not in it.
- Platform detection: each month the HTTP Archive loads the home page of every site in the Chrome UX Report and identifies its software with its own fork of Wappalyzer. Its Core Web Vitals Technology Report then credits each site's field data to every technology found on that home page.
- Unit: one origin, meaning one protocol and host such as https://www.example.com, counted once. A site passes a metric when the 75th percentile of its visits in the calendar month meets Google's threshold, and it passes Core Web Vitals when all three pass. Every percentage is a share of sites, so a small store and a large one weigh the same.
- Thresholds: Loading 2.5 seconds, Responsiveness 200 milliseconds, Visual stability 0.1, server response 800 milliseconds, First Contentful Paint 1.8 seconds. Until February 2024 the pass rate used First Input Delay, with a 100 millisecond threshold, for Responsiveness.
- Store platforms: every technology in the HTTP Archive ecommerce category with at least 2,000 mobile sites in the August 2026 technology list. Wix eCommerce and Squarespace Commerce count only Wix and Squarespace sites where a store was detected, so they differ from figures for Wix and Squarespace as a whole, which include sites that sell nothing.
- Segments: popularity ranks are the Chrome UX Report's own rank buckets, each one containing every higher-ranked site. Countries are the visitor's country. Any segment with fewer than 100 sites is left out.
- Lab data: JavaScript weight and Lighthouse scores come from the HTTP Archive's own load of each home page on a simulated phone, reported as the median per platform, with 1 KB counted as 1,000 bytes.
- Retrieval: the HTTP Archive Technology Report API, on October 4, 2026, for every month from January 2020 to August 2026.
What this data cannot tell you
- It cannot see Safari. No visit from an iPhone reaches the Chrome UX Report, so for a store whose shoppers mostly use iPhones, these numbers describe the minority.
- It only sees sites with traffic. Google publishes a site once it has enough eligible visits, so new and small stores are missing, and every average describes stores that already sell.
- It judges a site by its home page. The platform is detected on the home page and the whole site's visits are credited to it, including a blog or a checkout that runs on other software.
- It shows correlation, never cause. Platforms attract different owners, budgets, countries and product types, and none of that is controlled for. A WooCommerce store moved to Shopify does not inherit Shopify's average; it keeps its own photos, apps and audience.
- Hosted and self-hosted is our grouping. It follows each platform's usual setup. Magento also sells a cloud edition, Adobe Commerce Cloud, and Shopware offers a hosted one, and both count with the self-hosted majority.
- A site can count twice. A site where two platforms are detected appears under both, so the 1.58 million total is a sum of platform counts, not a count of unique stores.
Dataset, license and how to cite
The dataset behind this report is archived on Zenodo under a Creative Commons Attribution 4.0 license, with a permanent identifier: 10.5281/zenodo.23134346. It holds six CSV files covering every month from January 2020 to August 2026, the four charts in this report, a README with the data dictionary, and the two Python scripts that produced the files and every figure on this page, so anyone can rebuild the analysis or extend it with a newer month.
cwv_monthly.csv: Core Web Vitals pass rates for every platform, mobile and desktop, by month and metric, with the number of sites tested and passing.cwv_segments.csv: the same for the twelve platforms in the ranking chart and the whole web, by popularity rank and for 13 countries.lighthouse_monthly.csvandpage_weight_monthly.csv: median lab scores and page weight by platform.adoption_monthly.csvandplatforms.csv: sites per platform per month, and the platform list with its inclusion counts.
The source data is the Chrome UX Report by Google, licensed under Creative Commons Attribution 4.0, as processed by the HTTP Archive. Cite this report and the dataset as:
Wadowski, A. (2026). How Fast Are Online Stores? Speed Data by Platform. CartHacker. https://carthacker.com/trends/ecommerce-speed-statistics/
Wadowski, A. (2026). Ecommerce site speed by platform: Core Web Vitals from real visitors, 2020-2026 (Version 2026-08) [Data set]. https://doi.org/10.5281/zenodo.23134346
Store speed questions this data answers
Is Shopify faster than WooCommerce?
On average, yes. In August 2026, 76.5% of Shopify stores passed Core Web Vitals on mobile against 39.5% of WooCommerce stores, and most of the gap comes from the server: 81.9% of Shopify stores answer within 800 milliseconds, 12.7% of WooCommerce stores do. WooCommerce stores pass Responsiveness more often, 91.7% against 87.4%. A WooCommerce store on fast hosting with a full-page cache can beat the Shopify average, and Shopify or WooCommerce weighs the rest of the decision, cost included.
What percentage of websites pass Core Web Vitals?
53.0% of websites passed all three Core Web Vitals on mobile in August 2026 and 60.2% on desktop, with the mobile figure covering the 8,733,157 sites that had enough Chrome traffic to appear in the Chrome UX Report that month. In January 2021 it was 22.1%.
Will moving to a faster platform fix my store?
Not by itself. A platform average describes thousands of other stores, and yours keeps its images, apps, theme and visitors when it moves. Measure your own pages first. If the server is the bottleneck on a self-hosted store, better hosting and page caching fix that for far less than a migration, and if the bottleneck is JavaScript from apps and tags, the same apps will slow the store down on the new platform too.
How often does this data change?
Every month. Google publishes each month's Chrome UX Report on the second Tuesday of the following month, and the HTTP Archive adds it to the technology report after that. Every figure in this report is from the August 2026 release, the latest available on October 4, 2026.
Check your store's Core Web Vitals for free
Paste a product page address. You get the three scores right away, and a free account names every slow app and the fix for your platform.
Test my storeSources
- Data: HTTP Archive Technology Report and its documentation; Chrome UX Report methodology; CrUX on BigQuery for the monthly release schedule.
- Method: Introducing the Core Web Vitals Technology Report, HTTP Archive.
- Metric definitions: Web Vitals, Interaction to Next Paint, Time to First Byte, First Contentful Paint, Google.