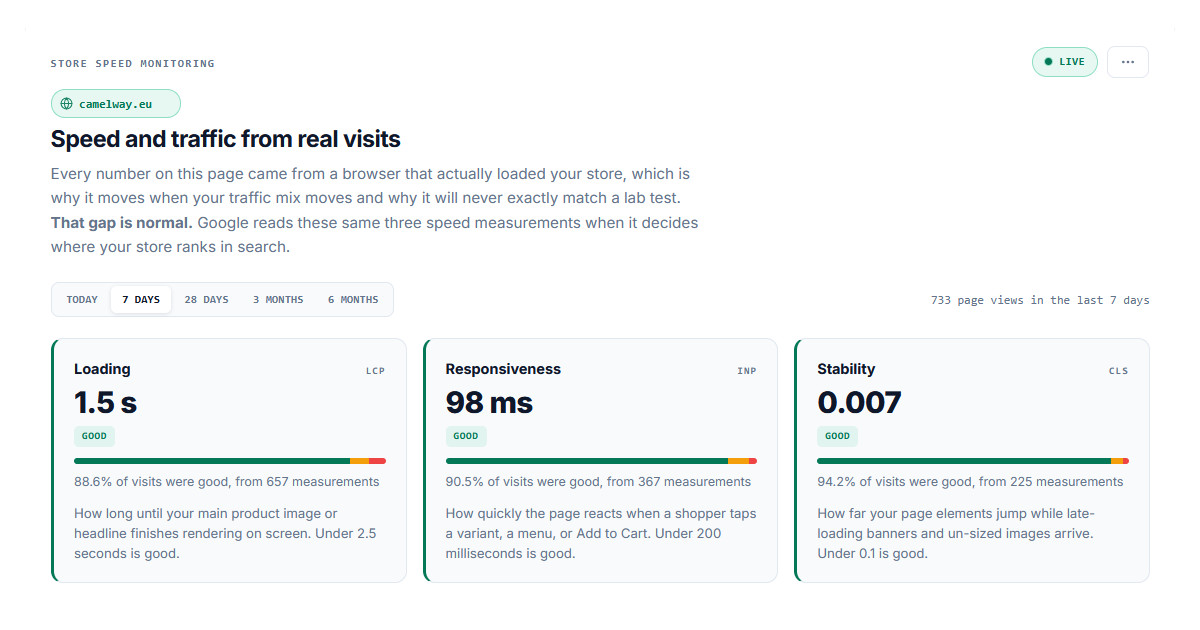
Core Web Vitals are the three speed measurements Google collects from real Chrome visitors to your store: how fast the main content appears, how quickly the page reacts to a tap, and how much the layout jumps while it loads. Each one has a pass mark. Loading (Largest Contentful Paint) has to finish within 2.5 seconds, Responsiveness (Interaction to Next Paint) within 200 milliseconds, and Visual stability (Cumulative Layout Shift) has to stay at 0.1 or lower, for at least three out of every four visits in the last 28 days.
This guide explains each score the way it plays out on a real store page, where Google gets the numbers, why so many small stores see "no data" instead of a score, and which fix moves which metric on Shopify and WooCommerce. It also uses the latest Chrome UX Report figures for almost 1.3 million sites built on Shopify, WooCommerce, Wix, Squarespace and BigCommerce, so you can see which platform tends to fail which test before you pay for an app that promises to fix it.
What are Core Web Vitals?
Core Web Vitals are three user experience metrics that Google defines, measures in the Chrome browser and reports in Search Console. Google files them under "page experience". For a store owner they answer three questions every shopper asks without noticing: can I see the product, does the button work, and will the page hold still long enough for me to tap it?
| Metric | What it measures on a store page | Good | Needs improvement | Poor |
|---|---|---|---|---|
| Loading (Largest Contentful Paint) | Time until the biggest element in view, usually the product photo, is on screen | 2.5 s or less | 2.5 to 4 s | over 4 s |
| Responsiveness (Interaction to Next Paint) | Delay between a tap, click or key press and the next visible reaction | 200 ms or less | 200 to 500 ms | over 500 ms |
| Visual stability (Cumulative Layout Shift) | How far visible content moves without the shopper causing it | 0.1 or less | 0.1 to 0.25 | over 0.25 |
Older guides list First Input Delay as the third metric. Google replaced it with Interaction to Next Paint on March 12, 2024, because First Input Delay timed only the start of the very first tap and ignored everything after it, so a store could pass while its Add to Cart button froze for a full second on the second tap. That loophole is closed.
How does Google score your store?
Google scores each metric at the 75th percentile of real page loads, separately for mobile and desktop, over a rolling 28-day window. In plain terms: take every visit from the last four weeks, line them up from fastest to slowest, and look at the visit three quarters of the way down the list. If that visit passes, the metric passes.
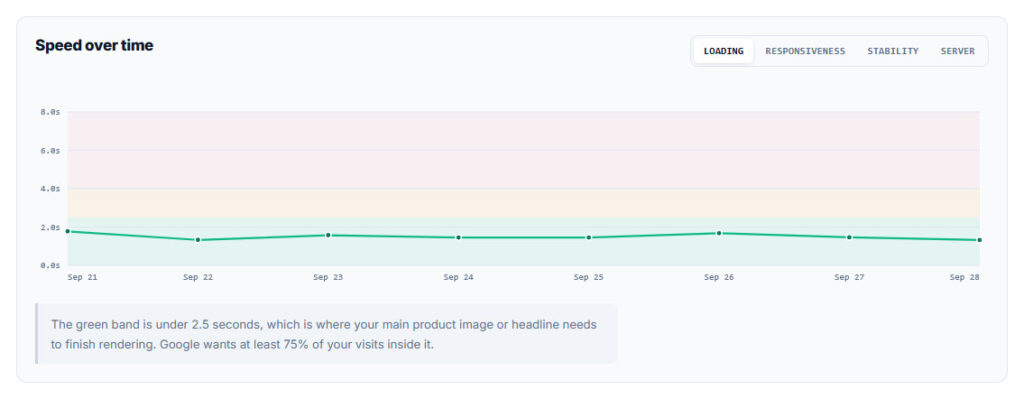
The percentile explains the most common speed complaint a store owner has: "the store loads in one second for me, so why does Google call it slow?" Your own visits come from a fast laptop on office Wi-Fi with everything already cached. The 75th percentile is decided by the slowest quarter of your real audience, which on a typical store means mid-range Android phones on a mobile connection, arriving cold from an ad or a search result and loading every script and photo for the first time. Paid traffic lands there.
What is the difference between field data and lab data?
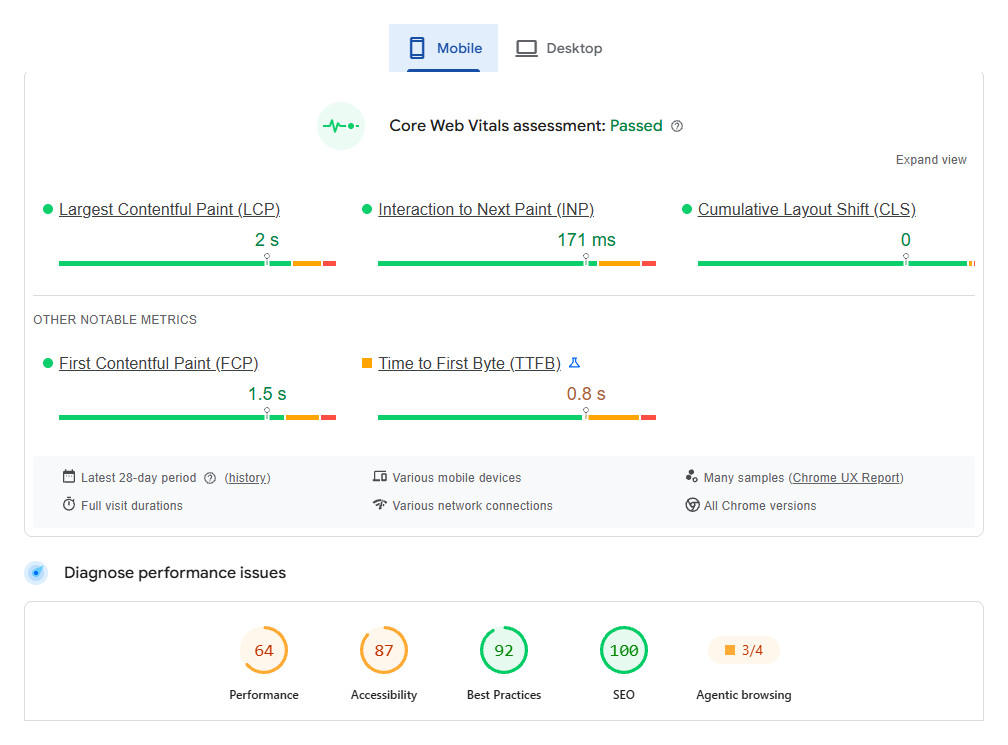
Field data is measured from real visitors, and lab data comes from one simulated page load in a controlled environment. They answer different questions. Google PageSpeed Insights puts both on the same screen, which is where most of the confusion starts: the top section, "Discover what your real users are experiencing", is field data from the Chrome UX Report, and it is the part that feeds Search Console. The large 0 to 100 Performance score further down comes from Lighthouse, a lab test of a single load on a simulated mid-range phone over a throttled connection.
A Lighthouse score of 100 does not mean you pass Core Web Vitals, and a score of 45 does not mean you fail. The lab score is a weighted blend of five lab measurements, and one of them, Total Blocking Time, stands in for Responsiveness because a lab test never taps anything. Use the lab report to find causes. Judge results by field data. Mixing the two up is how owners spend weeks chasing a lab score that Google's ranking systems never read.
Whose visits does Google count?
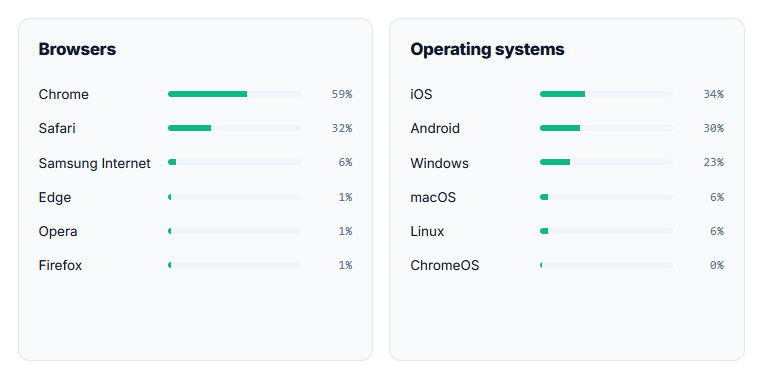
Google counts visits from Chrome on desktop and Android, from users who have usage statistics reporting turned on. Safari is not in it. The Chrome UX Report methodology excludes Chrome on iOS, Android apps that open pages in a WebView, Microsoft Edge and every other browser, which means no visit from an iPhone reaches the dataset behind your Core Web Vitals report.
That gap cuts both ways. An iPhone-heavy store can pass in Search Console while its Safari shoppers wait three seconds for a hero image, and an Android-heavy store can fail on the very phones its customers use. Measuring every browser yourself is the only way to see both halves, and since Safari 26.2 shipped in December 2025, Safari reports Loading and Responsiveness to scripts running on the page, the same way Chrome and Firefox do. Visual stability is still reported by Chrome-based browsers only.
Why does my store show "no data" in PageSpeed Insights?
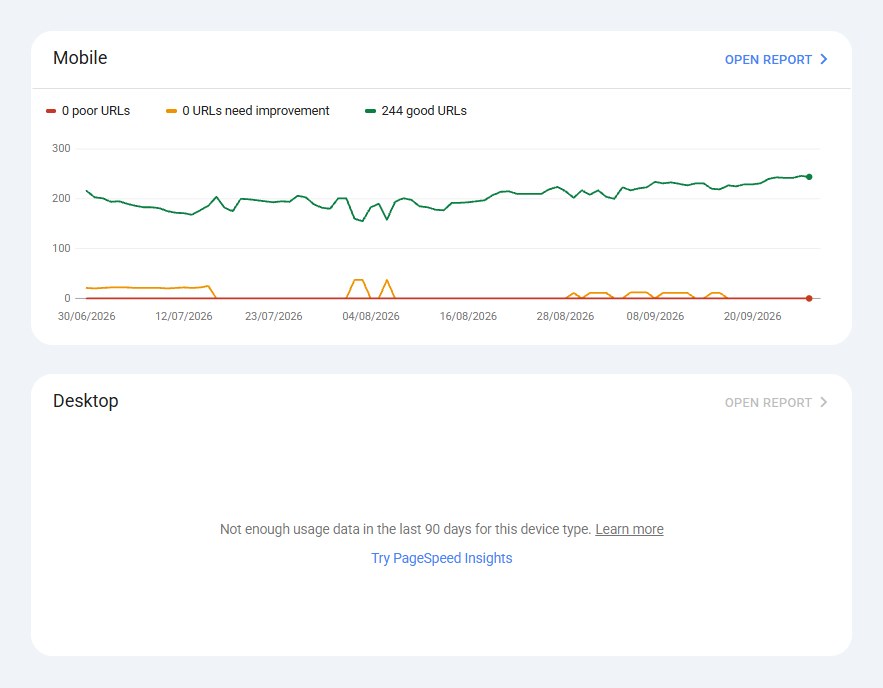
Your store shows "no data" because it has not had enough eligible Chrome visits for Google to publish a statistically stable number. Google does not disclose the threshold. It applies per URL and per origin, so a store can have data for the whole domain and still show nothing for an individual product page. Search Console reports the same gap as "Not enough data" and, where individual pages fall short, groups URLs together at origin level.
Most stores spend their first year inside this gap. It is where Google's own tools go quiet, because without field data you are left with lab tests, and a lab test cannot measure Responsiveness at all since it never taps anything. The answer is to collect your own.
Monitor your store's Core Web Vitals every day, for free
One snippet in your theme measures real shoppers. A free account keeps 7 days of history, Premium keeps 180.
Create a free accountDo Core Web Vitals affect Google rankings?
Yes, though far less than most speed plugin sales pages suggest. Google's documentation says plainly that "Core Web Vitals are used by our ranking systems", and on the same page that Google Search "always seeks to show the most relevant content, even if the page experience is sub-par." It also warns that good results in Search Console do not guarantee top rankings.
In practice, relevance and authority decide which pages compete for a query, and page experience separates pages that are otherwise close, which is why a thin product page will not outrank a better one just because it loads faster. Speed still pays. It pays after the click, on the conversion rate of every visitor you already bought or earned.
How much do slow Core Web Vitals cost a store?
The cleanest evidence comes from A/B tests, where half the traffic saw a faster version of the same page and nothing else changed. Two are public. Both are worth knowing by name, because they come up every time somebody argues that page speed is a developer's hobby with no line on the profit and loss statement.
- Vodafone split landing page traffic 50/50 between the existing page and an optimized one. The optimized version moved widget rendering to the server, resized the hero image and stopped loading images outside the visible area. Loading improved by 31%, and the result was 8% more total sales, a 15% better lead-to-visit rate and an 11% better cart-to-visit rate.
- Rakuten 24, the online store of Japan's Rakuten Group, ran a one-month A/B test where the only difference between the versions was Core Web Vitals work, with no functional or visual changes. Revenue per visitor rose 53.37%, conversion rate 33.13% and average order value 15.20%, while the exit rate fell 35.12%. Visual stability improved by 92.72% in the same test.
A third number gets quoted more often than both, and it needs a caveat. The "Milliseconds Make Millions" study by Deloitte Digital, commissioned by Google, followed 20.5 million sessions across 15 retail brands and found that a 0.1 second improvement in mobile site speed went together with 8.4% more conversions and a 9.2% higher average order value. That is a correlation with no control group. Google paid for it. Treat it as a direction and trust the A/B tests for size.
What is Loading (Largest Contentful Paint) on a store page?
Loading (Largest Contentful Paint) is the time from the moment a shopper starts loading a page until the largest image or block of text in the visible area is fully drawn. On a product page it is almost always the main product photo. On a home page it is the hero banner or the first slide, and on a collection page it is usually the collection banner or the first row of product cards. Good is 2.5 seconds or less.
Which part of Loading is slow?
Google splits Largest Contentful Paint into four consecutive parts, and the longest part tells you which fix to pay for. Order matters. A slow score on a fast server is an image problem. On a slow server, no image compression plugin from the Shopify App Store or wordpress.org will move the number much, because the photo cannot start downloading until the HTML page it sits in has arrived.
| Part | What happens | Healthy share | Usual cause on a store |
|---|---|---|---|
| Time to First Byte | The server sends the first byte of the HTML page | about 40% | Uncached WooCommerce pages, overloaded hosting, heavy theme templates |
| Resource load delay | The gap before the browser starts fetching the photo | under 10% | A lazy-loaded first image, a slider or app gallery that inserts the photo with JavaScript, a photo set as a CSS background |
| Resource load duration | Downloading the photo itself | about 40% | A 3,000-pixel original sent to a phone, no responsive image sizes |
| Element render delay | The photo has arrived but is not on screen yet | under 10% | Render-blocking stylesheets and scripts, a slider waiting for its script, web fonts |
Chrome shows this breakdown for any page you load yourself. Open DevTools with F12, record a page reload in the Performance panel, and open the Largest Contentful Paint insight in the sidebar, which names the element and splits its time into these four parts.
How to fix Loading on Shopify
Shopify runs the server and the image CDN for you, so on Shopify the Loading score is decided almost entirely by what your theme and your apps put in front of the product photo. View the page source first. Find the main product image. If it carries loading="lazy", the browser is told to wait before it even starts downloading the one image the score depends on. Recent versions of Dawn and most Online Store 2.0 themes already load the first product image eagerly, while older themes, custom builds and page builder apps often do not.
If your theme needs the change, this is the pattern for the main product image in a product template. It sends a correctly sized file to each screen, tells the browser the photo matters most, and leaves every other image on the page lazy-loaded as it should be.
{{ product.featured_media | image_url: width: 1500 | image_tag:
    widths: '400, 600, 800, 1000, 1200, 1500',
    sizes: '(min-width: 990px) 50vw, 100vw',
    loading: 'eager',
    fetchpriority: 'high',
    alt: product.featured_media.alt }}
Shopify's image_tag filter adds width and height to the image automatically, which also protects Visual stability. Its preload parameter sends a preload hint in the HTTP header; use it on one image per page at most, because preloading several images makes them compete with each other. The rest of the list is short:
- Replace an autoplaying hero video on mobile with a still image. A video is a large file and it becomes the Loading element on small screens.
- Check which app blocks load above the product photo, such as announcement bars, countdown timers and trust badge rows, and move them below it where you can.
- Keep web fonts to two families, and check the font settings in the theme editor before adding a font app.
- Remove code left behind by apps you uninstalled. Shopify does not always clean it out of theme.liquid, and editing theme code safely takes about ten minutes once you know where to look.
How to fix Loading on WooCommerce
On WooCommerce, start with Time to First Byte, because that is where most stores lose the Loading test before a single image downloads. In August 2026 only 12.7% of WooCommerce sites gave mobile visitors a good server response time of 800 milliseconds or less, against 81.9% of Shopify sites. Every image fix waits behind it.
Caching fixes most of it. A full-page cache serves visitors who are not logged in, using LiteSpeed Cache on LiteSpeed hosting, WP Rocket or your host's own cache elsewhere. Add a persistent object cache such as Redis for the pages that cannot be cached, which on a store means the cart, checkout and My Account pages, and run a current PHP version. If Time to First Byte is still above 800 milliseconds after that, the hosting plan itself is the limit, and choosing WooCommerce hosting covers what to pay for.
For the image itself, WordPress 6.3 and later add fetchpriority="high" to the image core judges most likely to be the largest in view, but themes, sliders and page builders that print their own image markup bypass that logic. Check the page source anyway. The deeper server work, from PHP workers to cart fragments, is in why WooCommerce stores are slow.
# 1. Did the page come from a cache? Look for HIT in one of these headers
curl -sI https://example.com/product/sample-product/ | grep -iE 'x-litespeed-cache|cf-cache-status|x-cache|^age'

# 2. Time to First Byte, measured from outside the server (run it twice: the first request may warm the cache)
curl -o /dev/null -s -w 'TTFB: %{time_starttransfer}s
' https://example.com/product/sample-product/
WP Rocket does not send a cache header; it marks a cached page with a comment at the very end of the HTML, so check the page source instead. A second request that still takes longer than 0.8 seconds points at hosting, PHP or the database, in that order.
What is Responsiveness (Interaction to Next Paint)?
Responsiveness (Interaction to Next Paint) measures how long the page takes to show a visible reaction after a shopper clicks, taps or presses a key. Scrolling, hovering and zooming do not count. The browser times every interaction during the visit and reports close to the worst one, ignoring one outlier for every 50 interactions on pages where people interact a lot. Good is 200 milliseconds or less, and anything over 500 milliseconds is poor.
On a store page, the interactions that fail are the ones that make money: choosing a size, tapping Add to Cart, opening the cart drawer, applying a filter on a collection. A tap that produces no visible reaction for half a second reads as a broken button. Shoppers tap again. That second tap is how a store collects duplicate cart lines, double-submitted forms and, most often, a visitor who decides something is wrong and leaves.
Why do store pages fail Responsiveness?
A page fails Responsiveness when the browser's main thread, the single lane that runs JavaScript and also paints the screen, is busy at the moment of the tap. The tap waits in line. On a store, the scripts ahead of it in that line are rarely the theme itself:
- Review, upsell and bundle apps that rebuild part of the product page every time the shopper picks a different variant.
- Chat widgets and popup builders that load their full code on every page view, including for the majority of visitors who never open them.
- Tracking pixels and tag managers firing several marketing tags on the same click as Add to Cart.
- Code from apps you uninstalled months ago, which still loads and still runs.
The platform data shows the pattern. Among the five largest store platforms, Shopify has the lowest share of sites passing Responsiveness on mobile, 87.4%, against 91.7% for WooCommerce and over 93% for Wix, BigCommerce and Squarespace. Shopify's servers are fast and its themes are lean, so the most likely thing standing between a tap and a reaction on a Shopify store is app code. The step-by-step method for finding the one that costs you the most is in finding the app that slows down a Shopify store.
How to find the script that blocks the tap
- Open a product page in Chrome: use an incognito window so your own browser extensions stay out of the measurement, then press F12 and open the Performance panel.
- Slow the processor down: set CPU throttling to 4x in the panel settings, because a laptop runs scripts several times faster than the mid-range phones that decide your 75th percentile.
- Record the interaction: start a recording, choose a variant and tap Add to Cart the way a shopper would, then stop the recording.
- Read the Interactions track: find the slow interaction, look at the long task underneath it and hover the script. Its address usually names the app that owns it.
- Confirm by switching it off: on Shopify, turn the app off under App embeds in the theme editor, or remove its block, then record the same interaction again and compare.
What is Visual stability (Cumulative Layout Shift)?
Visual stability (Cumulative Layout Shift) scores how much visible content moves without the shopper asking it to. Each unexpected shift gets a score based on how much of the screen moved and how far it travelled. The browser groups shifts that happen less than one second apart into bursts lasting up to five seconds, and the page's score is its worst burst, while any shift within half a second of a tap or click is left out because the shopper caused it. Good is 0.1 or less. Above 0.25 is poor.
The damage is easy to picture. A shopper aims for Add to Cart, a review widget finishes loading above it, the button drops 60 pixels, and the tap lands on a size chart link instead. On stores the usual causes are:
- Product, banner and logo images without width and height attributes, so the browser cannot reserve their space before the file arrives.
- Announcement bars, cookie banners and promotion strips inserted at the top of the page after it has started drawing.
- Review stars, stock counters and badge rows that apps inject into the product information after the page has loaded.
- Web fonts that swap in at a different size from the fallback font the browser drew first.
- Express checkout buttons and payment messaging that render after the rest of the product form.
Every fix is the same idea. Reserve the space before the content arrives. Images need width and height, which Shopify's image_tag and WordPress's own image functions add for you, so the work that remains is almost always content injected by apps, and for that you give the app's container a minimum height in your theme's CSS. The class names below are examples; the real ones depend on your theme and your apps.
/* Reserve the space a late-loading app fills, so nothing below it moves */
.product-reviews-summary { min-height: 24px; }
.announcement-bar { min-height: 40px; }

/* Embedded video: hold a 16:9 box before the player loads */
.product-video iframe { aspect-ratio: 16 / 9; width: 100%; height: auto; }
Chrome DevTools shows exactly which element moved. In the Performance panel, the Layout shifts track marks each shift, and selecting one highlights the element on the page along with its score.
Is Time to First Byte a Core Web Vital?
No, Time to First Byte is a diagnostic metric, and it sits underneath all three Core Web Vitals. It measures how long your server takes to send the first byte of the HTML page, and nothing else on the page, not the photo, not the stylesheet, not a single script, can start downloading before that byte arrives. Good is 800 milliseconds or less.
On Shopify, you barely touch it. Shopify runs the servers and the part you control is how much work your theme templates do on each request, while on WooCommerce Time to First Byte is the first number to fix, as the platform data below shows.
Barely is not never. In the PageSpeed Insights run shown earlier, the field Time to First Byte for camelway.eu, a Shopify store, came out at 0.8 seconds and was rated needs improvement, right on the line. A theme that does a lot of work on every request can cost time there too.
How do Shopify and WooCommerce stores score on Core Web Vitals?
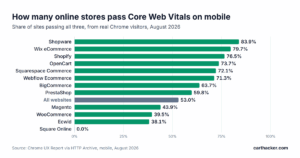
The Chrome UX Report publishes Core Web Vitals for every site with enough traffic, and the HTTP Archive groups them by the platform each site runs on. These are the mobile results for August 2026, as the share of sites with a good score on each metric.
| Platform | Sites measured | Pass all three | Loading | Responsiveness | Visual stability | Server response |
|---|---|---|---|---|---|---|
| Shopify | 443,647 | 76.5% | 87.3% | 87.4% | 92.5% | 81.9% |
| WooCommerce | 557,369 | 39.5% | 43.7% | 91.7% | 88.3% | 12.7% |
| Wix | 189,924 | 81.2% | 85.0% | 93.2% | 97.8% | 69.6% |
| Squarespace | 93,800 | 72.1% | 79.6% | 97.5% | 89.1% | 79.3% |
| BigCommerce | 11,704 | 63.7% | 85.3% | 96.8% | 73.0% | 63.9% |
Three readings matter for a store owner. WooCommerce fails almost entirely on Loading, 43.7% against Shopify's 87.3%, and the server response column explains why: only 12.7% of WooCommerce sites answer fast enough, so the photo starts late no matter how well it is compressed. On WooCommerce, the server is the fix. Shopify is the reverse, fast at the server and weakest on Responsiveness, which is where its app scripts run. Wix and Squarespace figures include many sites that sell nothing, so compare them with care.
Platform averages set a floor, and your own store can sit far above or below it. The full dataset is in store speed statistics by platform, and the wider platform decision, cost included, is in Shopify or WooCommerce.
Where can you check your Core Web Vitals?
Five tools cover the job, and each answers a different question. Knowing which one to open saves hours.
| Tool | Data | Best for | Limit |
|---|---|---|---|
| Google Search Console (Experience, then Core Web Vitals) | Field data, Chrome only, 28 days | Seeing which groups of URLs fail, on mobile and desktop | Needs traffic; confirming a fix takes a 28-day validation |
| PageSpeed Insights | Field data when published, plus one lab test | Checking one URL against Google's pass marks | The lab test cannot measure Responsiveness; small stores often get "no data" |
| Chrome DevTools, Performance panel | Your own visit, live | Finding the exact element or script behind a slow score | One device, your connection, your cache |
| CartHacker Store Speed Test | Google's Lighthouse lab test, plus field data when Google publishes it | Seeing which named apps and settings cost time, with the fix for your platform | One URL per test; it cannot test a checkout |
| CartHacker Core Web Vitals Monitoring | Field data from every visitor who loads your store | Daily trends, stores with no Google data, iPhone visitors | History starts the day you install the snippet |
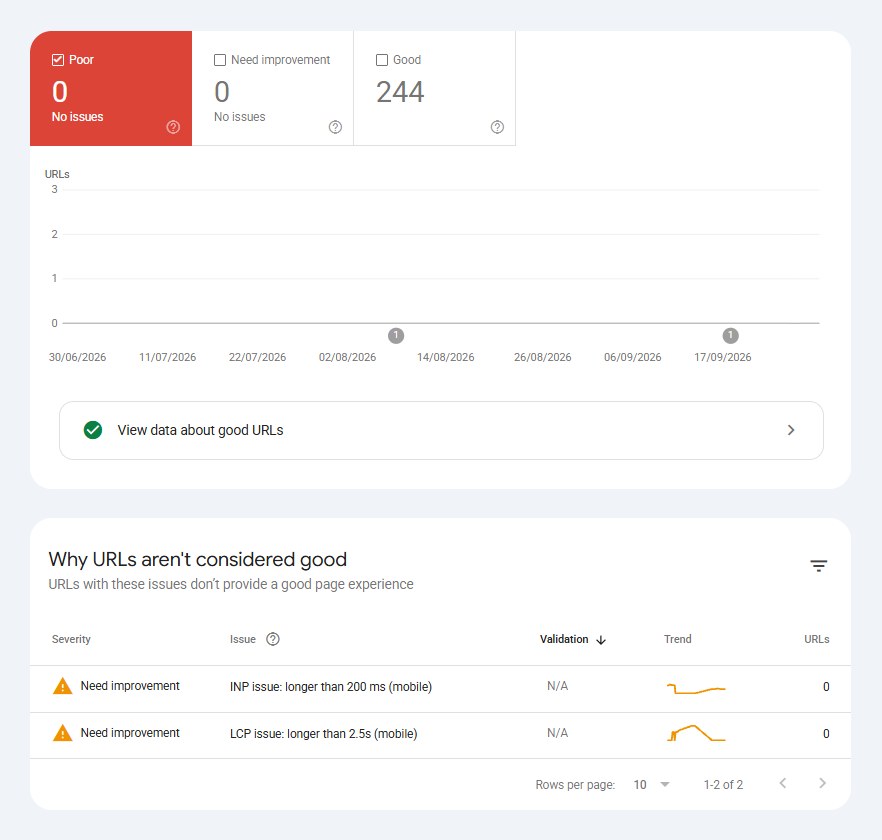
Search Console grades a group of URLs by its worst metric, so a group of product pages that passes Loading and Visual stability but fails Responsiveness shows as failing. Read the issue name, not only the color.
Check your store's Core Web Vitals for free
Paste a product page address. You get the three scores right away, and a free account names every slow app and the fix for your platform.
Test my store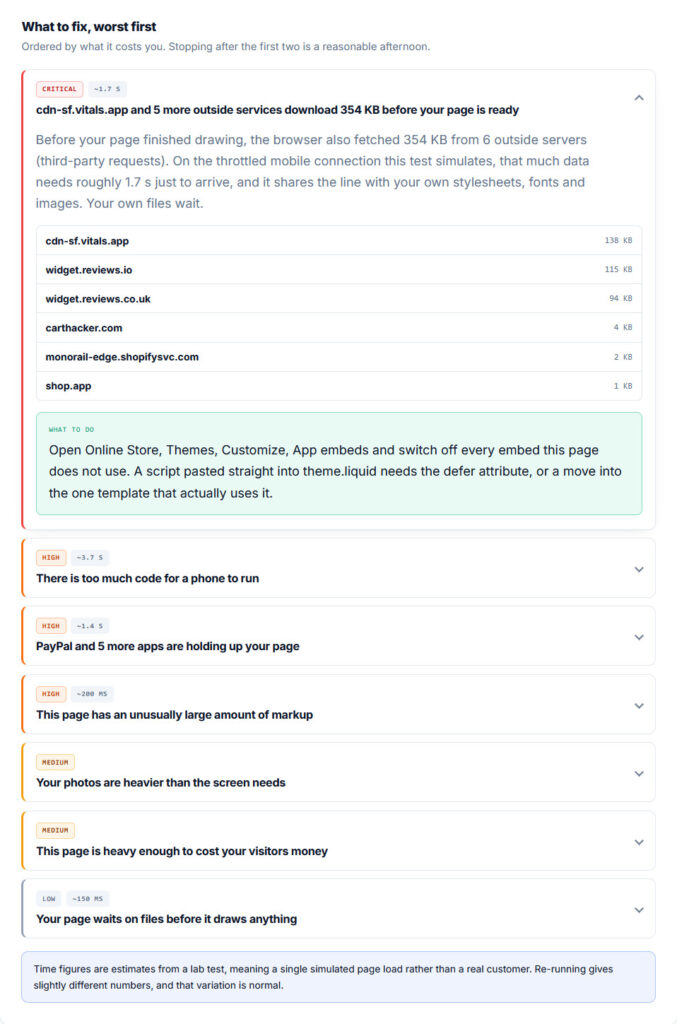
In what order should you fix Core Web Vitals?
Fix in the order the page loads, and measure before you touch anything. A store that works through these steps from the top rarely needs a speed app at the end.
- Get field data first: read Search Console if Google has data for your store, and install monitoring if it does not. Start with whichever metric fails on mobile.
- Test product pages, not only the home page: product templates carry the image gallery, reviews and upsell apps that the home page never loads, and they are where buying happens.
- Fix server time if it is over 800 milliseconds: page cache and object cache on WooCommerce, lighter theme templates on Shopify.
- Fix the Loading element: no lazy loading on the first product image, fetchpriority="high" on it, and responsive sizes so a phone never downloads a desktop file.
- Remove or delay the apps behind slow Responsiveness: test each suspect by switching it off and recording the same tap again.
- Reserve space for everything that loads late: image dimensions, minimum heights for app widgets, a fixed box for embedded video.
- Wait for the field data to catch up: Google's 28-day window means Search Console moves slowly, while your own monitoring shows the change within a day or two of real traffic.
Core Web Vitals questions store owners ask
Do I need a PageSpeed Insights score of 100 to pass?
No. The 0 to 100 score is a lab result from one simulated load, while passing Core Web Vitals is decided by field data from real visitors at the 75th percentile. A store can pass all three with a modest lab score and fail with a high one, because the lab measures one visit on one simulated phone and the field measures thousands of real visits on whatever phones your shoppers own. Judge by the field.
Why do PageSpeed Insights and Search Console show different numbers?
They summarize different slices of the same Chrome data. PageSpeed Insights shows one URL, or the whole origin when that URL lacks data, while Search Console groups similar URLs and grades each group by its worst metric. Both look at the previous 28 days. A fix you made last week therefore shows up in each of them gradually, at a slightly different pace.
How long does Google take to notice a fix?
Up to 28 days. The field data is a rolling 28-day window, so every day of fast visits pushes a day of slow ones out. In Search Console you can start a validation on a fixed issue, which tracks it for 28 days and then marks it as passed or failed. Your own monitoring shows the effect the day real visitors reach the fixed page.
Will a monitoring script slow down my store?
It should not. Ask any vendor for proof, ours included. The Core Web Vitals Monitoring snippet loads with the defer attribute, so the browser never waits for it before drawing the page, and it sends its measurements only when the visitor leaves or hides the tab. It writes no cookie and stores nothing on the visitor's device, so your consent banner stays as it is. Here is our proof: on camelway.eu, the Store Speed Test lists carthacker.com among the six outside services at 4 KB, next to 138 KB for the largest app bundle.
Does desktop matter, or only mobile?
Both are scored, separately. Mobile is almost always the harder test, because phones run scripts more slowly and often sit on weaker connections, and on most stores it is where the majority of visits come from. Fix mobile first. Desktop tends to follow.
Monitor your store's Core Web Vitals every day, for free
One snippet in your theme measures real shoppers. A free account keeps 7 days of history, Premium keeps 180.
Create a free accountSources and method
Thresholds, percentiles and metric definitions come from Google's own documentation. Platform figures come from the HTTP Archive Core Web Vitals Technology Report, which reads the public Chrome UX Report, for the August 2026 release on mobile, counting each origin once.
- Google, web.dev: Web Vitals, Interaction to Next Paint, Cumulative Layout Shift, Optimize Largest Contentful Paint.
- Google Search Central: Understanding page experience and Core Web Vitals and Google Search results.
- Chrome for Developers: Chrome UX Report methodology.
- Search Console Help: Core Web Vitals report.
- Case studies: Vodafone, Rakuten 24, Milliseconds Make Millions.
- Platform data: HTTP Archive Technology Report.
- Implementation: Shopify image_tag filter, Image performance enhancements in WordPress 6.3, Interop 2025 review.