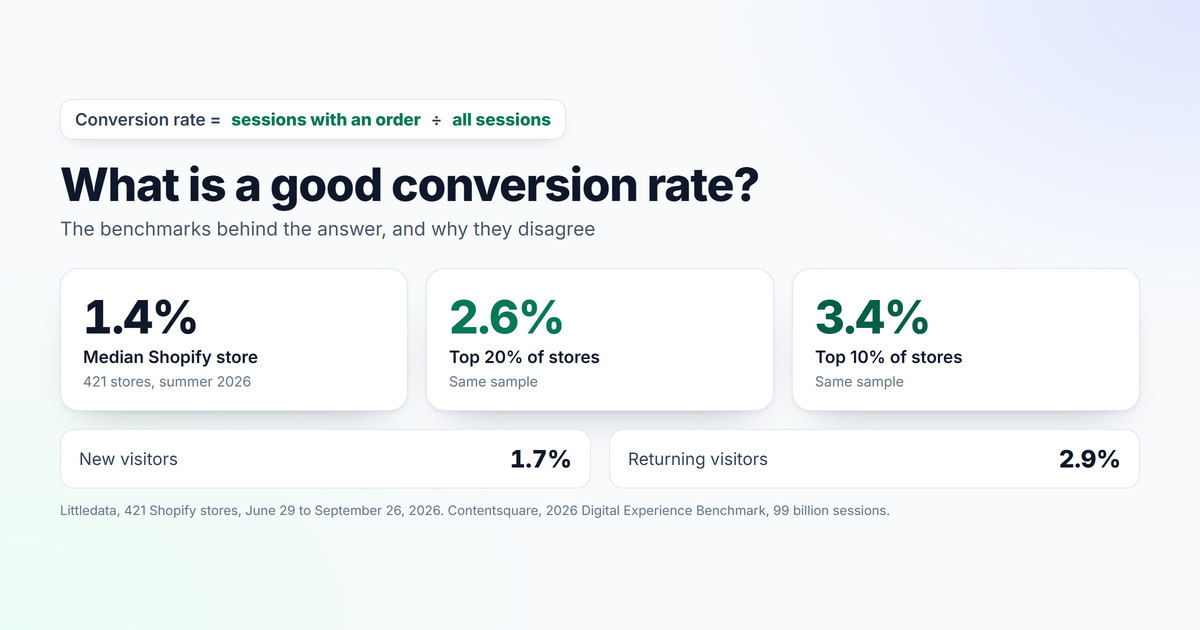
A typical Shopify store turns about 1.4% of its sessions into orders, 2.6% puts a store in the top 20%, and 3.4% puts it in the top 10%. Those figures come from Littledata. What counts as good for your own store depends on what you sell, where your visitors come from and how many of them come back, and the published benchmarks disagree with each other because they measure different stores in different ways.
I have built and tuned online stores since 1998. camelway.eu, a store I built and ran, went from almost no orders per visit in 2024 to about 1.9% by July 2026, and the story of that climb comes later in this guide.
What is conversion rate, and how is it calculated?
Conversion rate is the share of visits that end in an order. Shopify counts it as sessions that completed the checkout divided by all sessions, where a session is one visitor's activity with no gap longer than 30 minutes. A store with 10,000 sessions and 150 sessions that ended in an order has a conversion rate of 1.5%. The denominator is visits, not people. One shopper who comes back three times before buying counts as three sessions and one conversion.
What is a good conversion rate for an online store?
For a Shopify store, around 1.4% is typical, and anything above 2.6% puts you in the top fifth of stores, while 3.4% puts you in the top tenth. Bigger benchmarks differ. Their samples are different, and so are their definitions.
| Benchmark | Result | Who was measured |
|---|---|---|
| Median Shopify store | 1.4% | Littledata, 421 Shopify stores, June 29 to September 26, 2026 |
| Top 20% and top 10% of Shopify stores | 2.6% and 3.4% | Same sample |
| All ecommerce, 12-month average | 2.68% | Dynamic Yield's retail customers |
| Beauty, food and beverage | 5.38% and 4.56% | Dynamic Yield |
| Home and furniture, luxury and jewelry | 1.22% and 0.69% | Dynamic Yield |
| Returning and new visitors | 2.9% and 1.7% | Contentsquare, 99 billion sessions |
| Paid search, organic social | 2.8% and 0.7% | Contentsquare |
Littledata's figures come from Google Analytics 4 for stores with at least 1,000 sessions and 90 purchases in the period. Dynamic Yield's page was checked on October 5, 2026; Contentsquare's figures are from its 2026 Digital Experience Benchmark.
Why do conversion rate benchmarks disagree?
Three reasons, and each one can move the number by more than any change to your store. The first is the sample. Littledata measures Shopify stores of every size, Dynamic Yield measures the retailers that pay for its personalization software, and Contentsquare mixes websites and apps from more than 6,000 companies. A benchmark built from large retailers will sit above the median small store.
The second is how visits are counted. Google Analytics 4 often sees fewer visits than Shopify does, because in many countries visitors who decline analytics cookies are not counted at all. With what Google calls advanced consent mode, Analytics receives anonymous signals instead and estimates the missing visits. With the basic setup, nothing arrives. Fewer counted visits with the same orders means a higher conversion rate, so a store can look better in Analytics than in Shopify without anything changing.
The third is bots. Automated traffic adds sessions that never buy, and lowers the rate. Shopify changed how it counts sessions between September 21 and 23, 2026: identified bots are now filtered out of session reports by default, a session no longer ends at midnight UTC, and some visits without a page view, such as a shopper going straight to checkout from a cart link, now count. Shopify warns that your conversion rate can change because of this even when your orders have not, so compare the months after that date with care. Its bot filter is deliberately cautious, too: it would rather let some bots through than label a real customer as one.
What moves your conversion rate?
What you sell sets the starting point. In Dynamic Yield's data, beauty stores convert at 5.38% and luxury and jewelry at 0.69%, because a $40 cream is an easier decision than a $4,000 watch. Expensive, niche and unfamiliar products convert lower everywhere, so compare yourself with stores like yours.
Where visitors come from matters as much. Contentsquare measured 2.8% for paid search and 0.7% for organic social, because a person who searched for the product is closer to buying than one who scrolled past it. Returning visitors convert at 2.9% against 1.7% for new ones, which is why the customers who come back are worth as much attention as the ones you buy ads for. How to raise your average order value shows how returning customers drove one store's growth.
How one niche store raised its conversion rate
camelway.eu sells camel milk powder. It is a niche product with an expensive raw material, and its average order is about €125. In most of 2024 it converted under 0.25% of sessions. By the first half of 2025 it was at around 0.5% to 0.8%, by late 2025 at about 1%, and in July 2026 at about 1.9%, above the median Shopify store.
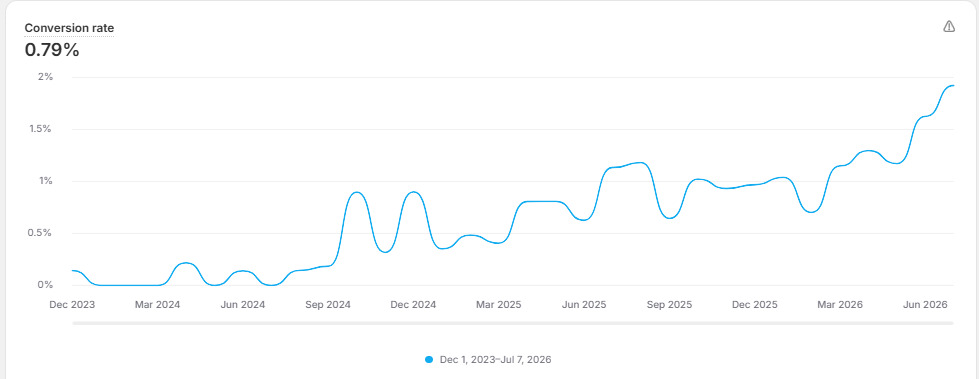
Many things moved that line, and no single one explains it. The biggest changes went in during January 2025 and January 2026, and in my own reading of the store, conversion work on the product page and the cart and a steady email program did most of it, while the share of sales from returning customers kept growing. Paid traffic tells the same story. Google Ads now converts at about 2% for the store, with very high bids, and that is strong for a product this niche and this expensive: Contentsquare's 2.8% for paid search averages every kind of store, while categories of expensive products sit far lower, such as 0.69% for luxury and jewelry in Dynamic Yield's data. The chart ends in early July 2026, before Shopify changed its session counting.
How to raise your conversion rate
- Fix the product page first, where most shoppers decide: the product page checklist.
- Remove the reasons shoppers leave the cart: why shoppers abandon their carts.
- Show proof where the doubt appears: do trust badges work?
- Bring shoppers back with the three automated emails in the emails every store should send.
- Raise what each order is worth while you do it: average order value.
- Keep the pages fast on phones, because a slow page loses the visit before any of the rest can work: what Google's speed scores mean.
How to measure your conversion rate properly
- Pick one source and stay with it. On Shopify, use Shopify Analytics; on WooCommerce, Google Analytics 4 with consent mode set up.
- Compare with your own past, ideally the same month a year earlier, so seasons do not fool you.
- Split the number by traffic source, device and new or returning visitors; the total hides where the gains and losses are.
- Mark the date of every change to the store, so you can see which one moved the line.
- On Shopify, note September 21 to 23, 2026, when session counting changed, before you compare across it.
Monitor your store's Core Web Vitals every day, for free
One snippet in your theme measures real shoppers. A free account keeps 7 days of history, Premium keeps 180.
Create a free accountConversion rate questions store owners ask
What is a good conversion rate for a Shopify store?
Around 1.4% is typical, the median of 421 Shopify stores in Littledata's summer 2026 benchmark. A rate of 2.6% puts a store in the top 20%, and 3.4% in the top 10%.
What is the average ecommerce conversion rate?
It depends on who is measured: 1.4% for the median Shopify store in Littledata's data, and 2.68% across Dynamic Yield's retail customers, with categories ranging from 0.69% for luxury and jewelry to 5.38% for beauty.
Why did my Shopify conversion rate change in September 2026?
Shopify changed how it counts sessions between September 21 and 23, 2026. It now filters identified bots by default, keeps sessions going past midnight UTC and counts some visits without a page view, so your conversion rate can move even when your orders have not.
Do returning visitors convert better?
Yes. In Contentsquare's 2026 benchmark, returning visitors converted at 2.9% and new visitors at 1.7%, so a store that brings people back raises its overall rate.
Sources
- Littledata: Ecommerce conversion rate benchmarks, 421 Shopify stores, June 29 to September 26, 2026.
- Dynamic Yield: Conversion rate benchmarks, checked October 5, 2026.
- Contentsquare: 2026 Digital Experience Benchmark, conversions.
- Shopify Help Center: Session measurement update and Bot filtering. Google: Consent mode in Google Analytics.
- camelway.eu, Shopify Analytics, conversion rate, December 1, 2023 to July 7, 2026.