On November 6, 2026, I typed four questions about cart abandonment into Google. All four AI Overviews started with the same number: 70.22%. Then they listed dozens of other figures from other websites, and on the same afternoon the cart abandonment rate for food and drink stores was 38.16% in one answer and 82% in another.
So where does 70.22% come from, and should you compare your store with it? I went back to the source that nearly everyone cites, the Baymard Institute's list of cart abandonment studies, and rebuilt the average from every study on it.
If you've read that "seven in ten carts are abandoned" and you're wondering whether your own number is good or bad, I'll show you what the average cart abandonment rate really measures, how old and how independent the studies behind it are, which number to quote, and how to calculate the rate for your own store.
Where the 70.22% average comes from
Baymard's list collects 50 cart abandonment studies published between 2006 and 2025, and 70.22% is their simple average. I recalculated it from the list and got exactly the same result, so the math is right. What's behind it is less solid than the two decimal places suggest.
The studies are old. Their median year is 2013, and only six of them are from 2021 or later. Mobile shopping, Shop Pay, Apple Pay and guest checkout all changed how people buy since most of these numbers were measured.
And the studies don't count the same thing. One company divides carts by orders on its clients' stores, another counts sessions, a third asks shoppers in a survey. The list puts them side by side and averages them as if they measured the same thing.
Most of the studies come from companies that sell cart recovery
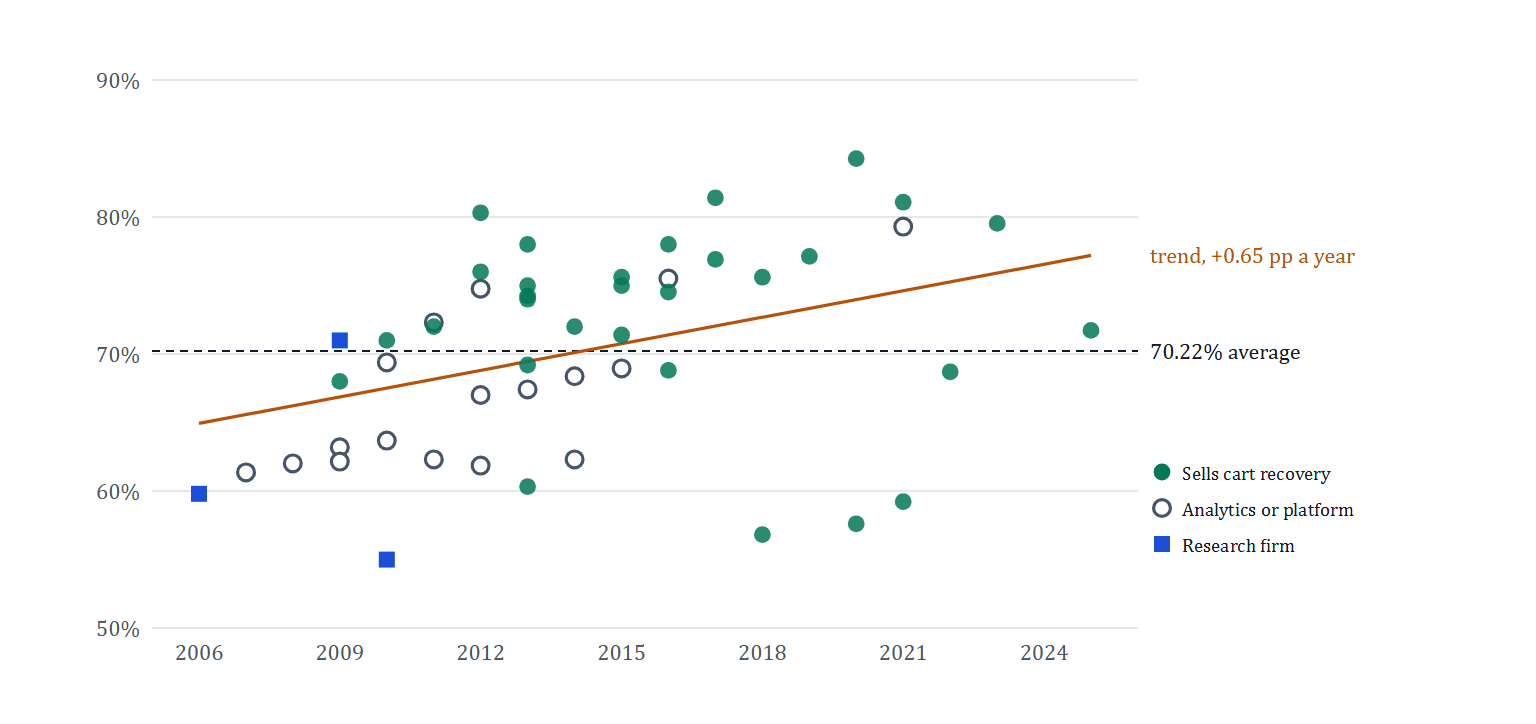
I sorted the 50 studies by who published them. Three in five of them come from companies that sell cart recovery or remarketing: abandoned cart emails, retargeting ads, exit pop-ups. Their studies come out about six points higher than the ones from analytics companies, platforms and research firms.
| Who published the study | Studies | Average abandonment rate |
|---|---|---|
| Companies that sell cart recovery or remarketing | 30 | 72.78% |
| Analytics companies and platforms | 17 | 67.17% |
| Research firms | 3 | 61.93% |
| All 50 studies | 50 | 70.22% |
Studies on Baymard Institute's cart abandonment list in its October 2026 update, sorted by the publisher's business.
I don't think anyone made these numbers up. A company that sells cart recovery measures the stores that bought cart recovery, which are often the stores with the problem. But three companies (IBM, SaleCycle and Listrak) supplied almost half of the studies, so a few client lists weigh heavily in the "industry average". That's not something you'd guess from a number with two decimal places, is it?
Same year, very different numbers
If 70% were a measured rate, studies from the same year would land close to each other. They don't. In 2021, SaleCycle reported 81.08% and Fresh Relevance reported 59.22%, and reports from the same year differ by up to 26.7 points on the list.
That gap is bigger than any change a store owner could make with a better checkout. It comes from definitions and client lists, not from shoppers.
Seven ways to average the same list: 66.4% to 77.2%
Even the average depends on choices. Here's what the same 50 studies give with seven reasonable methods:
| How you average the list | Result |
|---|---|
| Simple average of all 50 (Baymard's figure) | 70.22% |
| Median of all 50 | 71.19% |
| Average without the top and bottom 10% | 70.40% |
| One study per publisher, the latest one | 70.46% |
| Only studies from 2021 to 2025 | 73.26% |
| Without cart recovery vendors | 66.38% |
| Trend line, value for 2025 | 77.20% |
The trend is the surprise for me. Over the years the studies rise by about 0.65 points a year, so the newest data points to a higher rate than 70%, not a lower one. But six recent studies are too few to say that with confidence, and I wouldn't quote the trend value either.
What Google's AI Overviews do with it
The AI Overviews I saved used Baymard's average as the first line, then mixed it with figures from other sites. Mobile cart abandonment ran from 76.98% to 86% between answers. None of them said that the numbers came from different years, different definitions or vendors with something to sell.
That's how a number gets more certain the more it's repeated. An AI answer cites a blog, the blog cites Baymard, and Baymard's figure is an average of vendor reports, most of them more than ten years old. Do you want to plan your budget around that chain?
How to calculate your own cart abandonment rate
Your own number is the only one that'll tell you something about your store. The cart abandonment rate formula is:
cart abandonment rate = 1 - (orders / sessions with an add to cart)Say 400 sessions added something to the cart and 104 of them ended with an order (the numbers are only an example). Then the rate is 74%.
- On Shopify: the Conversion rate breakdown in Analytics shows sessions with cart additions, sessions that reached checkout and sessions that completed checkout. Use a full month, so one busy weekend doesn't move the result.
- On WooCommerce and other platforms: in Google Analytics 4, build a funnel from the add_to_cart event to the purchase event.
Compare your rate with your own last month, not with 70%. And split it in two: how many carts never reach the checkout, and how many checkouts never become an order. Those two steps have different causes, and the reasons shoppers leave and the fixes for each depend on which one is bigger.
A slow cart page is one cause you can check in a minute (the Store Speed Test can test your /cart page, though no outside test reaches Shopify's checkout itself).
Test how fast your cart page loads
Paste a product page address and see its three Core Web Vitals scores and the total delay. A free account names the 5 apps that cost the most time, with the fix for your platform.
Test my storeHow to quote the number
If you write about cart abandonment, I'd quote it with its range and age: "about 70%, the average of 50 studies from 2006 to 2025 collected by the Baymard Institute; the single studies range from 55% to 84%". That's honest, and it's still a useful number for one thing: it shows that most carts on most stores don't turn into orders, so a high rate on your store is normal and not a sign that something is broken.
How I checked the 50 studies
I saved Baymard's list on the same day as the Google answers, recorded each study's year, rate and publisher, and sorted the publishers into cart recovery vendors, analytics companies and platforms, and research firms. Every figure in those four AI answers went into a table with its source. The paper, the table of studies and the code are open on Knowledge Commons Works.
Sources
Baymard Institute, Kukar-Kinney and Close, Rajamma, Paswan and Hossain and 4 more7
- Baymard Institute: cart abandonment rate statistics (updated October 28, 2026)
- Where the 70% cart abandonment rate comes from, preprint with data and code (Knowledge Commons Works, November 2026)
- Kukar-Kinney and Close: the determinants of online shopping cart abandonment (Journal of the Academy of Marketing Science, 2010)
- Rajamma, Paswan and Hossain: why do shoppers abandon shopping carts? (Journal of Product and Brand Management, 2009)
- Google Search Central: AI features and your website
- Shopify Help Center: behavior reports and conversion
- Google Analytics: funnel exploration

Discussion 0
Ask a question or share what you saw on your own store.
No comments yet.