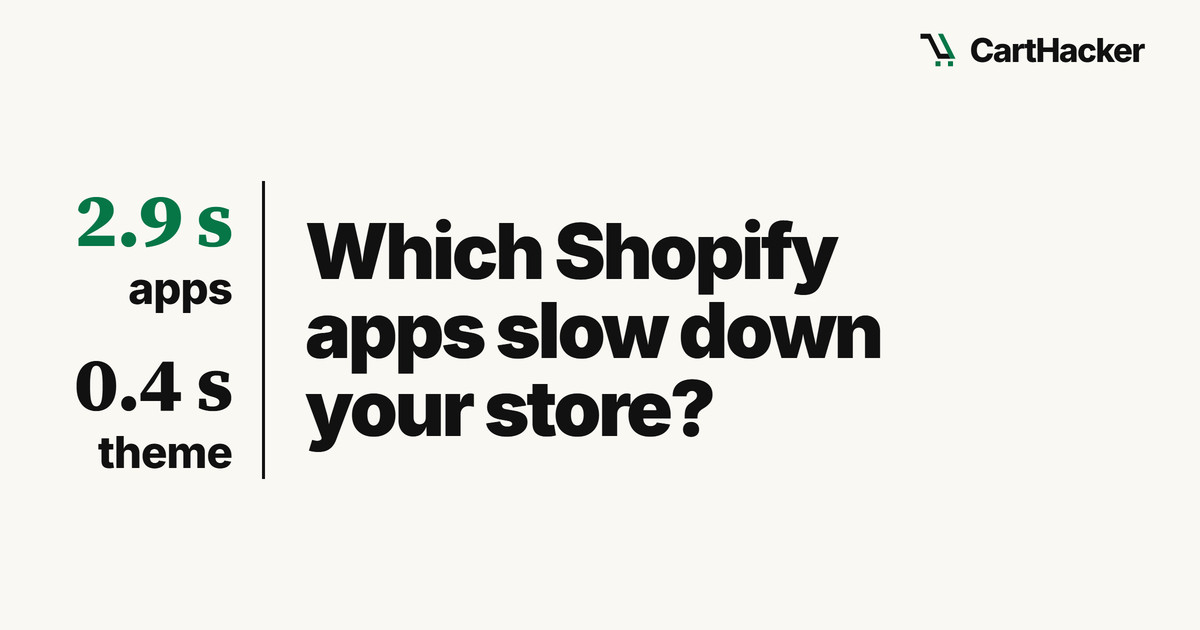
When a Shopify store feels slow, the first advice it gets is usually about the theme: switch to a lighter one, or buy a speed optimization service that "cleans up the theme code". I tested the product pages of 396 Shopify stores, picked at random, to see where the time really goes. The theme took 0.4 seconds of processor time on a typical page. The apps took 2.9 seconds.
That's measured on the simulated mid-range phone that Google's Lighthouse uses, and "apps" here includes the tracking tags that stores add through apps (Google's tag, the Meta Pixel). On the typical product page they used twice as much time as all of Shopify's own code.
If your Shopify store is slow and you're about to change themes, read this first. You'll see which Shopify apps slow down a store the most, how much each one costs, how many apps a typical store runs, and how to find the expensive ones on your own product page in a few minutes.
Apps take more processor time than the theme on 80% of pages
A phone has to run every script a page loads, one task at a time, on its main processor thread. While that thread is busy, the page doesn't respond when a shopper presses Add to cart or swipes the photo gallery. Lighthouse counts the blocked part of that time as Total Blocking Time, and Google's "good" mark is under 200 milliseconds.
Only 2.8% of the product pages I tested reached that mark. On four pages in five, app scripts took more processor time than the theme did. The median page loaded 16 apps and third-party services.
| Who runs the script | Processor time on the median product page |
|---|---|
| Apps and third-party services | 2.9 seconds |
| Shopify's own code (checkout buttons, analytics, the pixel sandbox) | 1.5 seconds |
| The theme | 0.4 seconds |
Lighthouse 13.5 on a simulated mid-range phone, product pages of 396 Shopify stores, November 9 and 10, 2026.
Part of Shopify's own time is app work, too. The app and ad pixels you add in Shopify run inside a sandbox called web pixels, and that sandbox alone took a median of 730 milliseconds. So if an app's pixel looks free, its cost may be hiding in Shopify's line.
More apps, slower product page
The number of apps predicted the blocking time better than anything else I looked at. Pages with five apps or fewer had a median Total Blocking Time of 459 milliseconds; pages with more than 20 apps had 2,332 milliseconds, about five times as much.
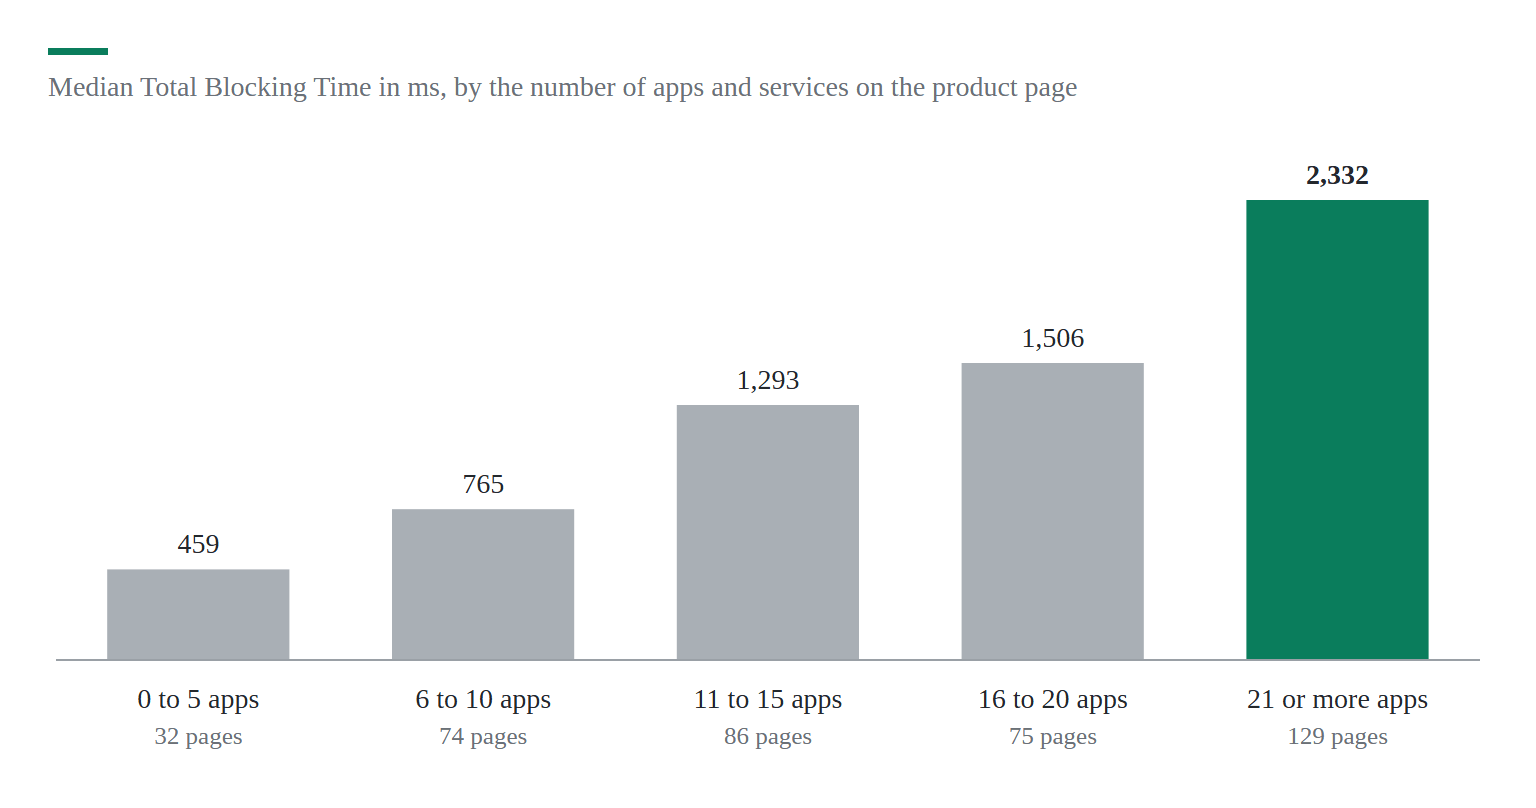
The largest group in the sample was the one at the top: 129 of 396 product pages loaded more than 20 apps and services. How many does yours load? Count them before you guess. Tracking tags, chat widgets and review stars don't feel like apps once they're installed, but the phone still has to run each one.
The Shopify apps that cost the most time
The two most expensive scripts weren't Shopify apps in the usual sense. They were Google's tag and the Meta Pixel, the tracking codes that Google Ads, Google Analytics and Facebook ads need. Google's tag was on 79.8% of product pages and took a median of 744 milliseconds where it loaded. Review apps came next, at about half a second each.
| App or service | On how many product pages | Median processor time where it loads |
|---|---|---|
| Gorgias (chat) | 8.1% | 851 ms |
| Google tag (gtag.js, Google Tag Manager) | 79.8% | 744 ms |
| Meta Pixel | 57.8% | 585 ms |
| Judge.me (reviews) | 34.8% | 505 ms |
| Loox (reviews) | 6.6% | 493 ms |
| Yotpo (reviews) | 5.3% | 493 ms |
| Microsoft Clarity | 34.6% | 484 ms |
| Klaviyo | 42.7% | 297 ms |
| PayPal | 6.6% | 295 ms |
| Klarna | 5.6% | 211 ms |
| Swym Wishlist | 5.1% | 121 ms |
| Smile.io (loyalty) | 5.8% | 86 ms |
Lighthouse 13.5, simulated mid-range phone. Only apps found on at least 5% of the 396 product pages, and only the time of scripts that belong to the app.
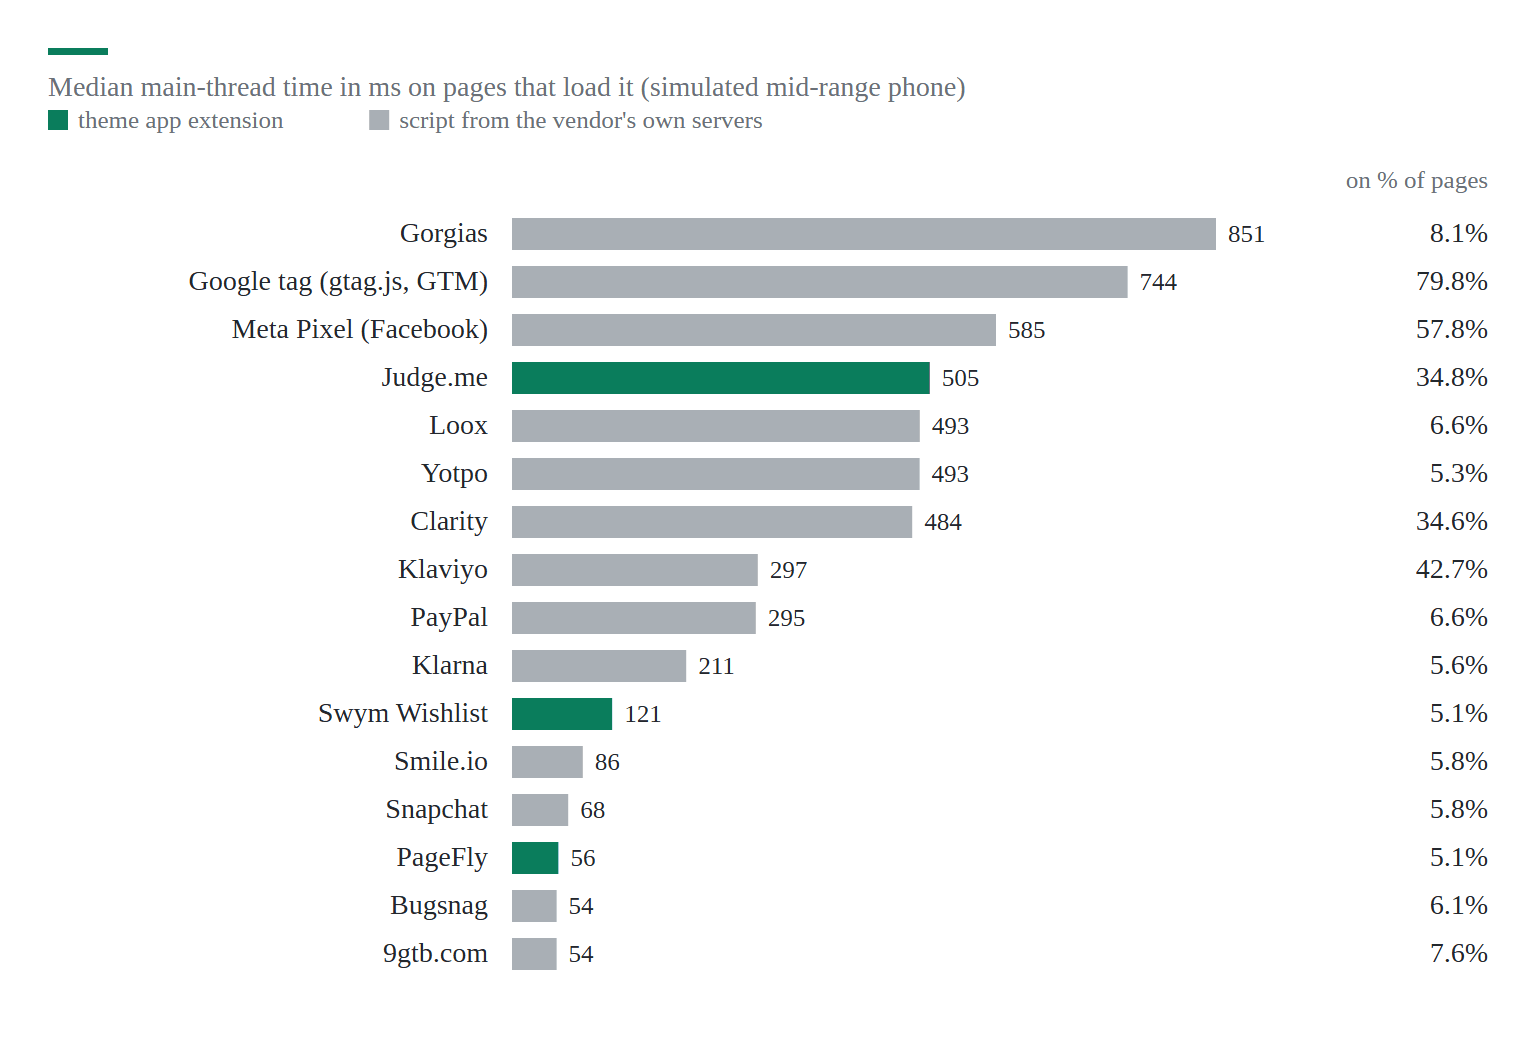
Two things in this table changed what I'd tell an owner. First, you can't guess an app's speed from what it does: the loyalty widget Smile.io cost 86 milliseconds, and a chat widget cost ten times as much.
Second, the most common slow script is Google's own tag. Many stores load it twice, once from the Google & YouTube app and once from a Google Tag Manager snippet someone pasted into theme.liquid years ago.
Review apps need a separate note. Each of the three big ones cost about half a second. Did you switch review apps once and keep the old one installed "just in case"? Then your shoppers pay that half second twice.
How to find the slow apps on your own store
- Test your best-selling product page. Skip the home page here, because the product page is where shoppers decide, and it's where most apps load. You can run the free Store Speed Test on it; with a free account it names the five heaviest apps on that page with their cost.
- Look for the same service twice. Two Google tags, two review widgets or two chat bubbles are the cheapest win: removing the copy changes nothing a shopper sees.
- Check your pixels. Go to Settings > Customer events in the Shopify admin and disconnect pixels of ad platforms you no longer pay for.
- Remove what you don't use. Uninstall the app in Settings > Apps, then check that its code is gone from the theme. Apps built with theme app extensions remove themselves, but older apps could add code to theme.liquid that stays after you uninstall them.
- Test the same page again after each change, so you know which app gave you the time back.
On one store I measured step by step, the PayPal button alone cost 547 milliseconds, and every visitor paid it, PayPal users or not. That's the kind of thing you only find by testing one page, one change at a time.
See the five heaviest apps on your product page
Paste a product page address and see its three Core Web Vitals scores and the total delay. A free account names the 5 apps that cost the most time, with the fix for your platform.
Test my storeShopify has a rule for this, too. An app with the Built for Shopify badge may cost a store at most 10 points of its Lighthouse performance score. When two apps do the same job, I'd pick the one with the badge.
What one test run can't tell you
Lighthouse loads each page once, on a simulated phone, and the result moves from run to run. To see how much, I tested 40 of the pages a second time, three to seven hours later. Their Total Blocking Time changed by a median of 14.6%, but almost all of them loaded the same apps, and the order from fast to slow barely moved.
So I'd treat one number for one page as rough, and the pattern across 396 pages as solid. That's also why the Store Speed Test result for your page can differ a little each time you run it.
Two more limits. I ran the tests from Europe, where some stores hold back tracking tags until a shopper accepts cookies, so a few tags may cost more for your US visitors than they did for me. And Lighthouse doesn't press buttons like a person does, so the speed of the reaction to a real shopper's tap is outside what it sees; for that you need data from real visits, which is what Core Web Vitals Monitoring collects.
How I picked and tested the 396 stores
I took the Shopify stores from the Chrome UX Report top million list of September 2026, shuffled them, opened each home page to find one product page, and ran Lighthouse 13.5 on it, one store at a time. Then a script matched each script on the page to its owner: an app (by its theme app extension or its known domain), Shopify, or the theme. I tested 410 pages, and 396 gave a usable result (the others redirected to another site or didn't finish loading).
Sources
Google Chrome, Lighthouse, Chrome for Developers and 6 more9
- Google Chrome: Lighthouse (version 13.5.0)
- Lighthouse: network and CPU throttling
- Chrome for Developers: Total Blocking Time
- Shopify: Built for Shopify requirements (storefront performance)
- Shopify: theme app extensions
- Shopify: web pixels
- HTTP Archive Web Almanac 2024: third parties
- third-party-web: which company owns which script
- CrUX Top Lists (September 2026)


Discussion 0
Ask a question or share what you saw on your own store.
No comments yet.